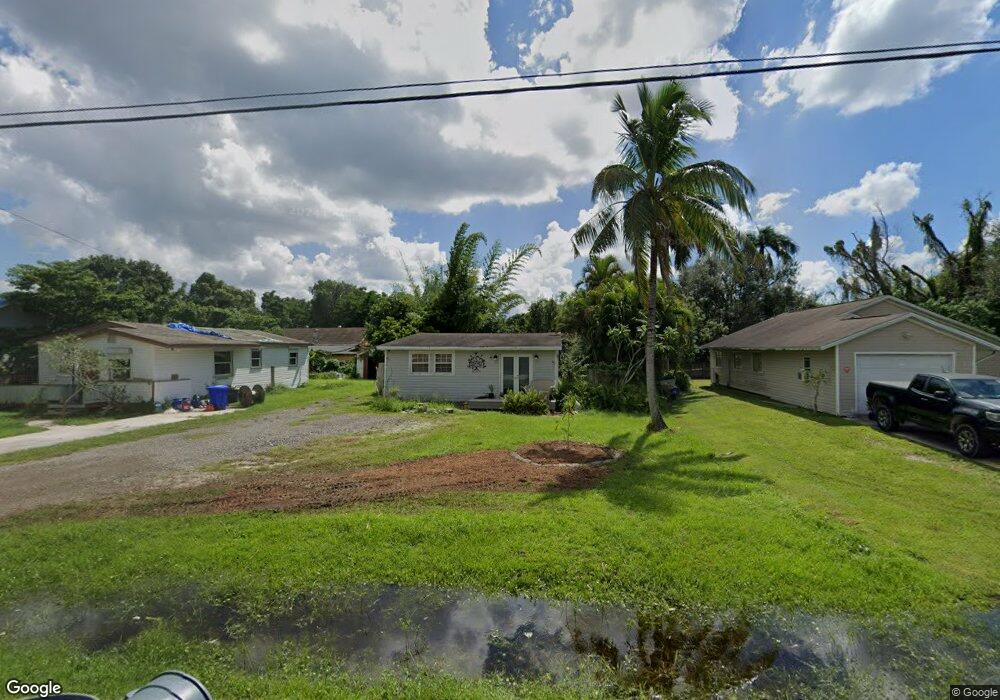
2310 Moreno Ave Fort Myers, FL 33901
Maravilla NeighborhoodEstimated Value: $197,168 - $234,000
2
Beds
2
Baths
1,234
Sq Ft
$175/Sq Ft
Est. Value
About This Home
This home is located at 2310 Moreno Ave, Fort Myers, FL 33901 and is currently estimated at $215,542, approximately $174 per square foot. 2310 Moreno Ave is a home located in Lee County with nearby schools including Allen Park Elementary School, Edison Park Creative & Expressive Arts School, and Orangewood Elementary School.
Ownership History
Date
Name
Owned For
Owner Type
Purchase Details
Closed on
Sep 28, 2015
Sold by
Davis Nicole Marie
Bought by
Wilkinson John M and Wilkinson Mona L
Current Estimated Value
Purchase Details
Closed on
Aug 26, 2010
Sold by
Wilkinson John M and Wilkinson Mona L
Bought by
Davis Nicole Marie
Home Financials for this Owner
Home Financials are based on the most recent Mortgage that was taken out on this home.
Original Mortgage
$115,000
Interest Rate
3.24%
Mortgage Type
Seller Take Back
Purchase Details
Closed on
Apr 16, 2010
Sold by
Nartowicz Roxanne J and Nartowicz Joshua A
Bought by
Wilkinson John M and Wilkinson Mona L
Purchase Details
Closed on
Dec 12, 2006
Sold by
Wilkinson John M and Wilkinson Mona L
Bought by
Nartowicz Roxanne J and Wilkinson John M
Purchase Details
Closed on
Apr 1, 2006
Sold by
Poveda Rosa
Bought by
Wilkinson John M and Wilkinson Mona L
Create a Home Valuation Report for This Property
The Home Valuation Report is an in-depth analysis detailing your home's value as well as a comparison with similar homes in the area
Home Values in the Area
Average Home Value in this Area
Purchase History
| Date | Buyer | Sale Price | Title Company |
|---|---|---|---|
| Wilkinson John M | $86,504 | None Available | |
| Davis Nicole Marie | $115,000 | Wilkinson Title Agency Inc | |
| Wilkinson John M | -- | None Available | |
| Nartowicz Roxanne J | -- | None Available | |
| Wilkinson John M | $70,000 | None Available |
Source: Public Records
Mortgage History
| Date | Status | Borrower | Loan Amount |
|---|---|---|---|
| Previous Owner | Davis Nicole Marie | $115,000 |
Source: Public Records
Tax History Compared to Growth
Tax History
| Year | Tax Paid | Tax Assessment Tax Assessment Total Assessment is a certain percentage of the fair market value that is determined by local assessors to be the total taxable value of land and additions on the property. | Land | Improvement |
|---|---|---|---|---|
| 2025 | $1,869 | $100,065 | -- | -- |
| 2024 | $1,787 | $90,968 | -- | -- |
| 2023 | $1,787 | $82,698 | $0 | $0 |
| 2022 | $1,580 | $75,199 | $0 | $0 |
| 2021 | $1,340 | $82,904 | $8,400 | $74,504 |
| 2020 | $1,283 | $75,102 | $7,200 | $67,902 |
| 2019 | $1,187 | $67,025 | $3,400 | $63,625 |
| 2018 | $1,115 | $61,369 | $3,400 | $57,969 |
| 2017 | $1,013 | $49,260 | $3,400 | $45,860 |
| 2016 | $925 | $41,532 | $3,400 | $38,132 |
| 2015 | $208 | $33,596 | $2,950 | $30,646 |
| 2014 | $189 | $27,100 | $2,950 | $24,150 |
| 2013 | -- | $30,696 | $3,500 | $27,196 |
Source: Public Records
Map
Nearby Homes
- 2107 Unity Ave
- 3266 Royal Palm Ave
- 2123 Braman Ave
- 2400 Hunter Terrace
- 2251 Hanson St
- 2431 Welch St
- 2561 Parkway St
- 2252 Maple Ave Unit 2254
- 13 Broadway Cir
- 2403 Maple Ave
- 2956 Powell St
- 2116 Pineview Rd
- 2941 Powell St
- 2055 Waltman St
- 2816 Central Ave
- 2828 Jackson St Unit E6
- 2828 Jackson St Unit F-7
- 2828 Jackson St Unit H5
- 2828 Jackson St Unit I3
- 2828 Jackson St Unit M5
- 2314 Moreno Ave
- 2308 Moreno Ave
- 2312 Moreno Ave
- 2342 Moreno Ave
- 2344 Moreno Ave
- 2346 Moreno Ave
- 2232 Moreno Ave
- 2362 Moreno Ave
- 2230 Moreno Ave
- 2354 Moreno Ave
- 2352 Moreno Ave
- 2224 Moreno Ave
- 2358 Moreno Ave
- 2226 Moreno Ave
- 2222 Moreno Ave
- 2239 Unity Ave
- 2307 Unity Ave
- 2305 Unity Ave
- 2216 Moreno Ave
- 2331 Unity Ave