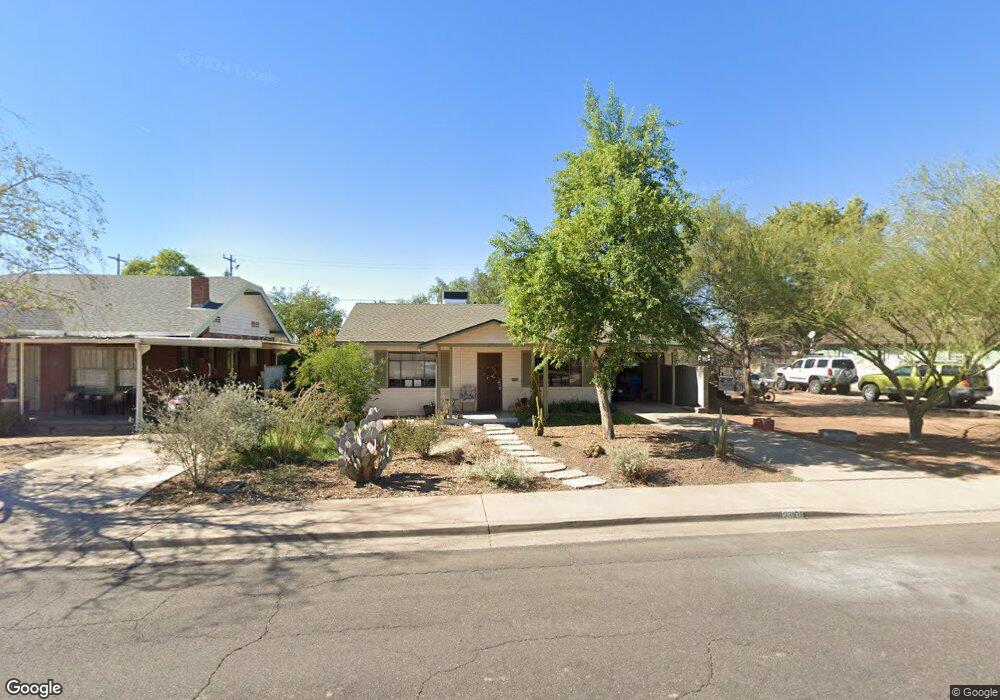
2310 N 13th St Phoenix, AZ 85006
Coronado NeighborhoodEstimated Value: $352,000 - $492,821
--
Bed
1
Bath
876
Sq Ft
$487/Sq Ft
Est. Value
About This Home
This home is located at 2310 N 13th St, Phoenix, AZ 85006 and is currently estimated at $426,455, approximately $486 per square foot. 2310 N 13th St is a home located in Maricopa County with nearby schools including Whittier Elementary School, North High School, and Phoenix Coding Academy.
Ownership History
Date
Name
Owned For
Owner Type
Purchase Details
Closed on
Jun 9, 2004
Sold by
Rowe M Suzanne
Bought by
Denzin Dawn
Current Estimated Value
Home Financials for this Owner
Home Financials are based on the most recent Mortgage that was taken out on this home.
Original Mortgage
$108,800
Outstanding Balance
$53,613
Interest Rate
6.12%
Mortgage Type
New Conventional
Estimated Equity
$372,842
Purchase Details
Closed on
Jan 23, 2003
Sold by
Long Murray Laverne
Bought by
Clute Jo B
Home Financials for this Owner
Home Financials are based on the most recent Mortgage that was taken out on this home.
Original Mortgage
$10,745
Interest Rate
5.97%
Mortgage Type
Seller Take Back
Purchase Details
Closed on
Jun 10, 1997
Sold by
Piatkowski Mary C
Bought by
Rowe M Suzanne
Home Financials for this Owner
Home Financials are based on the most recent Mortgage that was taken out on this home.
Original Mortgage
$62,934
Interest Rate
7.91%
Mortgage Type
FHA
Create a Home Valuation Report for This Property
The Home Valuation Report is an in-depth analysis detailing your home's value as well as a comparison with similar homes in the area
Home Values in the Area
Average Home Value in this Area
Purchase History
| Date | Buyer | Sale Price | Title Company |
|---|---|---|---|
| Denzin Dawn | $136,000 | Capital Title Agency Inc | |
| Clute Jo B | $40,000 | Stewart Title & Trust | |
| Rowe M Suzanne | $63,000 | Security Title Agency |
Source: Public Records
Mortgage History
| Date | Status | Borrower | Loan Amount |
|---|---|---|---|
| Open | Denzin Dawn | $108,800 | |
| Previous Owner | Clute Jo B | $10,745 | |
| Previous Owner | Rowe M Suzanne | $62,934 | |
| Closed | Denzin Dawn | $27,200 |
Source: Public Records
Tax History Compared to Growth
Tax History
| Year | Tax Paid | Tax Assessment Tax Assessment Total Assessment is a certain percentage of the fair market value that is determined by local assessors to be the total taxable value of land and additions on the property. | Land | Improvement |
|---|---|---|---|---|
| 2025 | $1,625 | $12,850 | -- | -- |
| 2024 | $1,509 | $12,238 | -- | -- |
| 2023 | $1,509 | $33,300 | $6,660 | $26,640 |
| 2022 | $1,451 | $27,030 | $5,400 | $21,630 |
| 2021 | $1,452 | $23,930 | $4,780 | $19,150 |
| 2020 | $1,473 | $23,060 | $4,610 | $18,450 |
| 2019 | $1,474 | $20,730 | $4,140 | $16,590 |
| 2018 | $1,447 | $16,820 | $3,360 | $13,460 |
| 2017 | $1,396 | $15,680 | $3,130 | $12,550 |
| 2016 | $1,356 | $13,830 | $2,760 | $11,070 |
| 2015 | $1,235 | $12,600 | $2,520 | $10,080 |
Source: Public Records
Map
Nearby Homes
- 2232 N 13th St
- 2227 N Evergreen St
- 2034 N Mitchell St
- 2314 N 11th St
- 1346 E Palm Ln
- 2501 N 11th St
- 2336 N 11th St
- 2206 N 11th St
- 2046 N 11th St
- 1445 E Monte Vista Rd
- 1342 E Granada Rd
- 1215 E Cambridge Ave
- 2531 N 15th St
- 2545 N 15th St
- 2502 N 10th St
- 2030 N 10th St
- 914 E Sheridan St
- 1326 E Almeria Rd
- 1116 E Almeria Rd
- 1422 E Windsor Ave
- 2318 N 13th St
- 2306 N 13th St
- 2320 N 13th St
- 2302 N 13th St
- 2309 N Edgemere St
- 2322 N 13th St
- 2315 N Edgemere St
- 2305 N Edgemere St
- 2317 N Edgemere St
- 2301 N Edgemere St
- 2309 N 13th St
- 2305 N 13th St
- 2313 N 13th St
- 2326 N 13th St
- 2317 N 13th St
- 2321 N Edgemere St
- 2301 N 13th St
- 2321 N 13th St
- 2325 N Edgemere St
- 2330 N 13th St