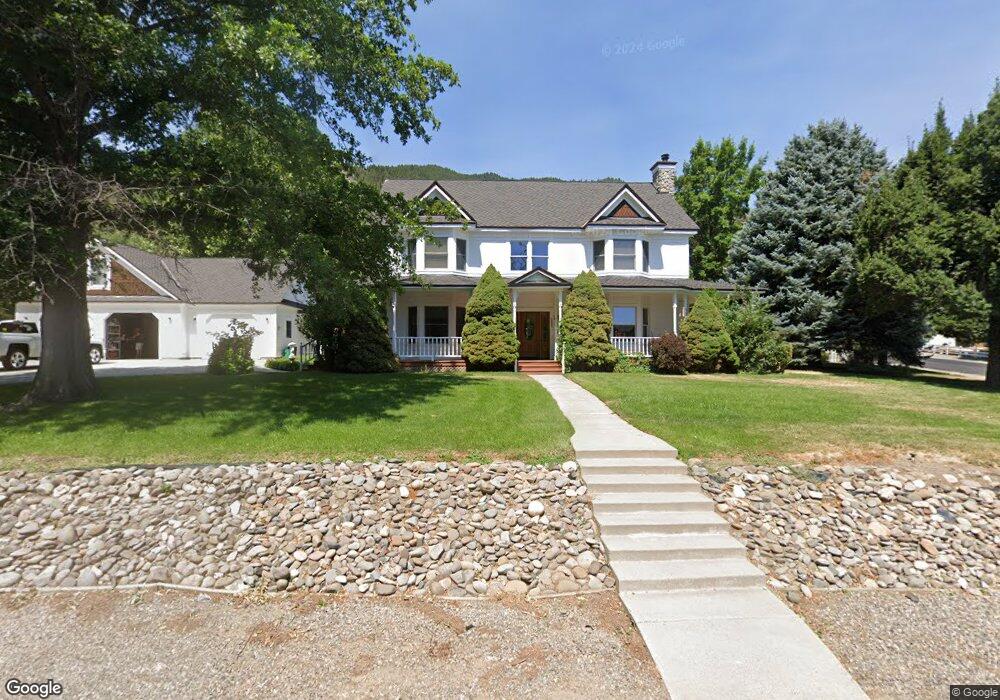
2310 Reese Ct Genoa, NV 89411
Estimated Value: $1,374,533 - $1,880,000
4
Beds
3
Baths
3,810
Sq Ft
$432/Sq Ft
Est. Value
About This Home
This home is located at 2310 Reese Ct, Genoa, NV 89411 and is currently estimated at $1,645,383, approximately $431 per square foot. 2310 Reese Ct is a home located in Douglas County with nearby schools including Jacks Valley Elementary School, Carson Valley Middle School, and Douglas County High School.
Ownership History
Date
Name
Owned For
Owner Type
Purchase Details
Closed on
Dec 23, 2019
Sold by
Dupree Michael L and Dupree Lynn Marie
Bought by
Genoa Golf Group Iv Llc
Current Estimated Value
Purchase Details
Closed on
May 23, 2012
Sold by
Webb William E and Webb Cindy A
Bought by
Webb William E and Webb Cindy A
Home Financials for this Owner
Home Financials are based on the most recent Mortgage that was taken out on this home.
Original Mortgage
$417,000
Interest Rate
3.86%
Mortgage Type
New Conventional
Purchase Details
Closed on
Aug 7, 2011
Sold by
Webb William E and Webb Cindy A
Bought by
Webb William E and Webb Cindy A
Home Financials for this Owner
Home Financials are based on the most recent Mortgage that was taken out on this home.
Original Mortgage
$468,500
Interest Rate
4.53%
Mortgage Type
New Conventional
Create a Home Valuation Report for This Property
The Home Valuation Report is an in-depth analysis detailing your home's value as well as a comparison with similar homes in the area
Home Values in the Area
Average Home Value in this Area
Purchase History
| Date | Buyer | Sale Price | Title Company |
|---|---|---|---|
| Genoa Golf Group Iv Llc | -- | None Available | |
| Webb William E | -- | Northern Nevada Title Cc | |
| Webb William E | -- | Northern Nevada Title Cc | |
| Webb William E | -- | Northern Nevada Title Cc | |
| Webb William E | $625,000 | Northern Nevada Title Cc |
Source: Public Records
Mortgage History
| Date | Status | Borrower | Loan Amount |
|---|---|---|---|
| Previous Owner | Webb William E | $417,000 | |
| Previous Owner | Webb William E | $468,500 |
Source: Public Records
Tax History Compared to Growth
Tax History
| Year | Tax Paid | Tax Assessment Tax Assessment Total Assessment is a certain percentage of the fair market value that is determined by local assessors to be the total taxable value of land and additions on the property. | Land | Improvement |
|---|---|---|---|---|
| 2025 | $5,507 | $202,384 | $77,000 | $125,384 |
| 2024 | $5,507 | $197,655 | $70,000 | $127,655 |
| 2023 | $5,346 | $190,998 | $70,000 | $120,998 |
| 2022 | $5,191 | $167,434 | $52,500 | $114,934 |
| 2021 | $5,040 | $155,713 | $45,500 | $110,213 |
| 2020 | $4,893 | $155,225 | $45,500 | $109,725 |
| 2019 | $4,750 | $147,297 | $38,500 | $108,797 |
| 2018 | $4,612 | $144,128 | $38,500 | $105,628 |
| 2017 | $4,478 | $145,199 | $37,800 | $107,399 |
| 2016 | $4,364 | $141,166 | $31,500 | $109,666 |
| 2015 | $4,355 | $141,166 | $31,500 | $109,666 |
| 2014 | $4,228 | $135,534 | $31,500 | $104,034 |
Source: Public Records
Map
Nearby Homes
- 212 Kinsey Way
- 182 Mill St
- 171 Mill St
- 2350 Jacks Valley Rd
- 275 Genoa Highlands Cir
- 2395 Jacks Valley Rd
- 2196 Genoa Heights Ln
- 2456 Genoa Meadows Cir
- 2414 Centennial Dr
- 337 Genoa Springs Dr
- 358 Genoa Springs Dr
- 370 Genoa Ln
- 380 Genoa Ln
- 2548 Jacks Valley Rd
- 004 Deerhaven
- 2545 Genoa Aspen Dr
- 2460 Deerhaven
- 2592 Eagle Ridge Rd Unit 29
- 2527 Eagle Ridge Rd
- 2582 Eagle Ridge Rd
- 195 Kinsey Way
- 205 Kinsey Way
- 2296 Reese Ct
- 202 Kinsey Way
- 208 Kinsey Way
- 2307 Main St
- 211 Kinsey Way
- 192 Kinsey Way
- 212 Kinsey Way + Quest Quarters
- 2293 Reese Ct
- 2335 Main St
- 214 Kinsey Way
- 2287 Reese Ct
- 215 Kinsey Way
- 227 Kinsey Way
- 2308 Main St
- 196 Genoa Ln
- 2328 Main St
- 233 Kinsey Way
- 216 Kinsey Way