23100 N High Ridge Rd Barrington, IL 60010
West Lake Barrington NeighborhoodEstimated Value: $535,862 - $664,000
--
Bed
3
Baths
2,580
Sq Ft
$236/Sq Ft
Est. Value
About This Home
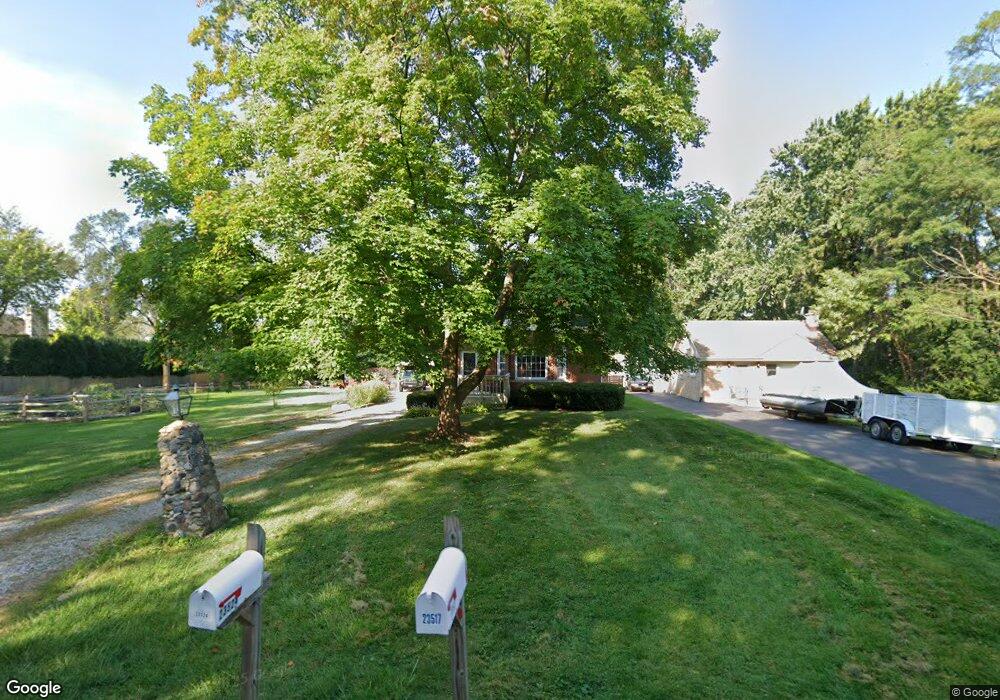
This home is located at 23100 N High Ridge Rd, Barrington, IL 60010 and is currently estimated at $608,466, approximately $235 per square foot. 23100 N High Ridge Rd is a home located in Lake County with nearby schools including Countryside Elementary School, Barrington Mdle School- Prairie Cmps, and Barrington High School.
Ownership History
Date
Name
Owned For
Owner Type
Purchase Details
Closed on
Jun 30, 2023
Sold by
Panagopoulos Dina
Bought by
Karamanis James A and Karamanis Sandra M
Current Estimated Value
Purchase Details
Closed on
Jan 17, 2007
Sold by
Panagopoulos Jennifer
Bought by
Panagopoulos Dina
Home Financials for this Owner
Home Financials are based on the most recent Mortgage that was taken out on this home.
Original Mortgage
$242,000
Interest Rate
6.19%
Mortgage Type
Purchase Money Mortgage
Purchase Details
Closed on
Nov 15, 1995
Sold by
Deeter Harry and Deeter Lorenia
Bought by
Panagopoulos Jennifer A
Home Financials for this Owner
Home Financials are based on the most recent Mortgage that was taken out on this home.
Original Mortgage
$239,850
Interest Rate
7.56%
Create a Home Valuation Report for This Property
The Home Valuation Report is an in-depth analysis detailing your home's value as well as a comparison with similar homes in the area
Home Values in the Area
Average Home Value in this Area
Purchase History
| Date | Buyer | Sale Price | Title Company |
|---|---|---|---|
| Karamanis James A | -- | None Listed On Document | |
| Panagopoulos Dina | -- | Law Title Oak Brook | |
| Panagopoulos Jennifer A | $266,500 | Chicago Title Insurance Co |
Source: Public Records
Mortgage History
| Date | Status | Borrower | Loan Amount |
|---|---|---|---|
| Previous Owner | Panagopoulos Dina | $242,000 | |
| Previous Owner | Panagopoulos Jennifer A | $239,850 |
Source: Public Records
Tax History Compared to Growth
Tax History
| Year | Tax Paid | Tax Assessment Tax Assessment Total Assessment is a certain percentage of the fair market value that is determined by local assessors to be the total taxable value of land and additions on the property. | Land | Improvement |
|---|---|---|---|---|
| 2024 | $8,877 | $144,381 | $24,962 | $119,419 |
| 2023 | $9,696 | $136,854 | $23,661 | $113,193 |
| 2022 | $9,696 | $147,735 | $26,768 | $120,967 |
| 2021 | $9,545 | $145,223 | $26,313 | $118,910 |
| 2020 | $9,288 | $144,775 | $26,232 | $118,543 |
| 2019 | $8,907 | $140,955 | $25,540 | $115,415 |
| 2018 | $8,361 | $136,405 | $26,436 | $109,969 |
| 2017 | $8,267 | $133,665 | $25,905 | $107,760 |
| 2016 | $8,079 | $128,623 | $24,928 | $103,695 |
| 2015 | $7,663 | $120,637 | $23,380 | $97,257 |
| 2014 | $8,380 | $126,171 | $27,426 | $98,745 |
| 2012 | $8,118 | $128,339 | $27,897 | $100,442 |
Source: Public Records
Map
Nearby Homes
- 9209 Jasmine Way
- 1034 Heather Ct
- 28629 W Ravine Dr
- 28442 W Main St
- 23490 N Spring Dr
- 23433 N Summit Dr
- 28876 W Pioneer Grove Rd
- 911 Johnson St
- 806 Norge Pkwy
- Lot 1 N Owl Ct
- 5 Jacqueline Ln
- 6 Jacqueline Ln
- LOT 2 Asbury Ave
- 14 W Surrey Ln
- Lot 1 Asbury Ave
- 300 Opatrny Dr Unit 122
- 300 Opatrny Dr Unit 126
- 300 Opatrny Dr Unit 107
- 503 N River Rd
- 902 Spring Beach Way
- 28897 W Main St
- 28880 W Bluff Ln
- 23166 N High Ridge Rd
- 28939 W Main St
- 23083 N High Ridge Rd
- 28884 W Main St
- 23105 N High Ridge Rd
- 23061 N High Ridge Rd
- 28916 W Main St
- 23163 N High Ridge Rd
- 23039 N High Ridge Rd
- 28959 W Main St
- 28881 W Bluff Ln
- 28918 W Bluff Ln
- 28930 W Main St
- 28792 W Main St
- 23021 N High Ridge Rd
- 28771 W Main St
- 28966 W Main St
- 23151 N Kelsey Ave