2311 E 5th St Anderson, IN 46012
Estimated Value: $49,801 - $106,000
2
Beds
1
Bath
672
Sq Ft
$106/Sq Ft
Est. Value
About This Home
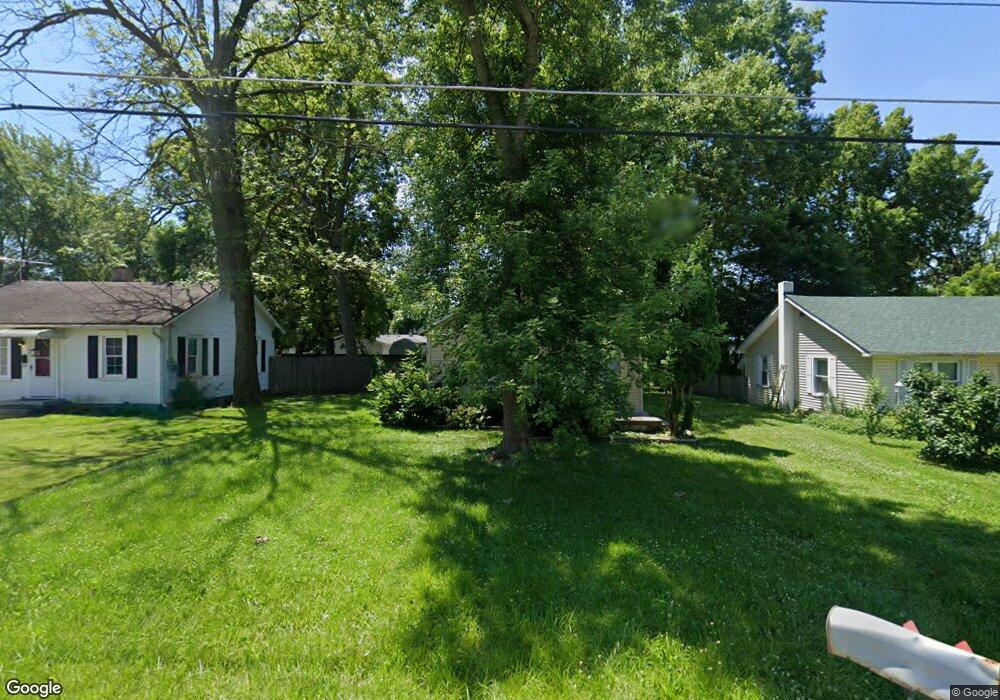
This home is located at 2311 E 5th St, Anderson, IN 46012 and is currently estimated at $71,450, approximately $106 per square foot. 2311 E 5th St is a home located in Madison County with nearby schools including Tenth Street Elementary School, Highland Middle School, and Anderson High School.
Ownership History
Date
Name
Owned For
Owner Type
Purchase Details
Closed on
Oct 31, 2024
Sold by
Grise Home And Property Group Llc
Bought by
Zedman Group Llc
Current Estimated Value
Purchase Details
Closed on
Mar 8, 2024
Sold by
Mitchum James
Bought by
Grise Home & Prop Group Llc
Purchase Details
Closed on
Nov 5, 2021
Sold by
Kocinski Ken
Bought by
Mitchum James
Purchase Details
Closed on
Dec 14, 2015
Sold by
Madison County Auditor
Bought by
Kocinski Ken
Purchase Details
Closed on
Apr 3, 2014
Sold by
Muncie Bargain Rentals Inc
Bought by
Hussain Sayad
Purchase Details
Closed on
Dec 15, 2013
Sold by
Indiana
Bought by
Muncie Inc
Purchase Details
Closed on
Dec 5, 2013
Sold by
Indiana Renewal & Dev Llc
Bought by
Muncie Bargain Rentals Inc
Purchase Details
Closed on
Feb 8, 2012
Sold by
Crouch Orson H and Crouch Marquerite E
Bought by
Indiana Renewal And Development Llc
Create a Home Valuation Report for This Property
The Home Valuation Report is an in-depth analysis detailing your home's value as well as a comparison with similar homes in the area
Home Values in the Area
Average Home Value in this Area
Purchase History
| Date | Buyer | Sale Price | Title Company |
|---|---|---|---|
| Zedman Group Llc | -- | Eagle Land Title | |
| Grise Home & Prop Group Llc | -- | None Listed On Document | |
| Mitchum James | $10,000 | None Available | |
| Kocinski Ken | $1,784 | -- | |
| Hussain Sayad | $7,000 | -- | |
| Muncie Inc | $5,000 | -- | |
| Muncie Bargain Rentals Inc | -- | -- | |
| Indiana Renewal And Development Llc | $1,954 | None Available |
Source: Public Records
Tax History
| Year | Tax Paid | Tax Assessment Tax Assessment Total Assessment is a certain percentage of the fair market value that is determined by local assessors to be the total taxable value of land and additions on the property. | Land | Improvement |
|---|---|---|---|---|
| 2025 | $427 | $57,700 | $9,300 | $48,400 |
| 2024 | $427 | $19,200 | $1,200 | $18,000 |
| 2023 | $394 | $17,500 | $1,200 | $16,300 |
| 2022 | $392 | $17,400 | $1,100 | $16,300 |
| 2021 | $147 | $6,400 | $1,100 | $5,300 |
| 2020 | $141 | $6,100 | $1,000 | $5,100 |
| 2019 | $136 | $5,900 | $1,000 | $4,900 |
| 2018 | $132 | $5,700 | $1,000 | $4,700 |
| 2017 | $114 | $5,700 | $1,000 | $4,700 |
| 2016 | $114 | $5,700 | $1,000 | $4,700 |
| 2014 | $712 | $35,400 | $8,400 | $27,000 |
| 2013 | $712 | $35,300 | $8,400 | $26,900 |
Source: Public Records
Map
Nearby Homes
Your Personal Tour Guide
Ask me questions while you tour the home.