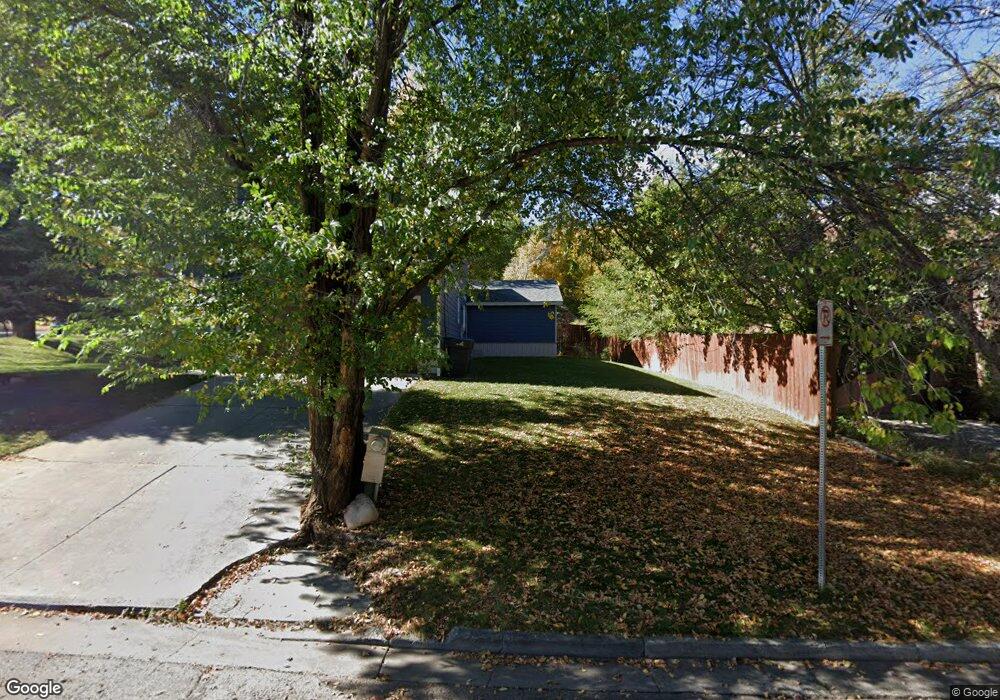
2311 Forest Ave Durango, CO 81301
Crestview NeighborhoodEstimated Value: $520,128 - $650,000
2
Beds
2
Baths
1,235
Sq Ft
$478/Sq Ft
Est. Value
About This Home
This home is located at 2311 Forest Ave, Durango, CO 81301 and is currently estimated at $590,032, approximately $477 per square foot. 2311 Forest Ave is a home located in La Plata County with nearby schools including Needham Elementary School, Miller Middle School, and Durango High School.
Ownership History
Date
Name
Owned For
Owner Type
Purchase Details
Closed on
Apr 15, 2025
Sold by
Santilli Sarah H
Bought by
Rubenstein Jay A
Current Estimated Value
Purchase Details
Closed on
Mar 28, 2023
Sold by
Allan Jay and Santilli Sarah Helen
Bought by
Allan Jay and Santilli Sarah Helen
Purchase Details
Closed on
May 15, 2013
Sold by
Stapleton John R
Bought by
Rubenstein Jay and Santilli Sarah
Home Financials for this Owner
Home Financials are based on the most recent Mortgage that was taken out on this home.
Original Mortgage
$174,000
Interest Rate
3.56%
Mortgage Type
New Conventional
Purchase Details
Closed on
Feb 16, 2006
Sold by
Karpel Unni and Karpel Paul R
Bought by
Stapleton John R
Home Financials for this Owner
Home Financials are based on the most recent Mortgage that was taken out on this home.
Original Mortgage
$40,350
Interest Rate
6.15%
Mortgage Type
Seller Take Back
Purchase Details
Closed on
Apr 29, 1999
Bought by
Rubenstein Jay and Santilli Sarah
Create a Home Valuation Report for This Property
The Home Valuation Report is an in-depth analysis detailing your home's value as well as a comparison with similar homes in the area
Home Values in the Area
Average Home Value in this Area
Purchase History
| Date | Buyer | Sale Price | Title Company |
|---|---|---|---|
| Rubenstein Jay A | -- | None Listed On Document | |
| Allan Jay | -- | None Listed On Document | |
| Rubenstein Jay | $272,000 | Stewart Title | |
| Stapleton John R | $269,000 | None Available | |
| Rubenstein Jay | $127,000 | -- |
Source: Public Records
Mortgage History
| Date | Status | Borrower | Loan Amount |
|---|---|---|---|
| Previous Owner | Rubenstein Jay | $174,000 | |
| Previous Owner | Stapleton John R | $40,350 |
Source: Public Records
Tax History
| Year | Tax Paid | Tax Assessment Tax Assessment Total Assessment is a certain percentage of the fair market value that is determined by local assessors to be the total taxable value of land and additions on the property. | Land | Improvement |
|---|---|---|---|---|
| 2025 | $1,176 | $33,060 | $5,100 | $27,960 |
| 2024 | $1,000 | $24,890 | $3,780 | $21,110 |
| 2023 | $1,000 | $27,840 | $4,230 | $23,610 |
| 2022 | $980 | $29,640 | $4,500 | $25,140 |
| 2021 | $984 | $24,790 | $3,690 | $21,100 |
| 2020 | $917 | $23,850 | $3,600 | $20,250 |
| 2019 | $877 | $23,850 | $3,600 | $20,250 |
| 2018 | $785 | $21,620 | $3,460 | $18,160 |
| 2017 | $768 | $21,620 | $3,460 | $18,160 |
| 2016 | $729 | $22,370 | $3,650 | $18,720 |
| 2015 | $683 | $22,370 | $3,650 | $18,720 |
| 2014 | $603 | $18,970 | $3,440 | $15,530 |
| 2013 | -- | $18,970 | $3,440 | $15,530 |
Source: Public Records
Map
Nearby Homes
- 2400 Arroyo Dr Unit 22
- 362 W 23rd St
- 1857 & 1865 W 3rd Ave
- 2024 W 2nd Ave
- 416 W 28th St
- 1840 W 3rd Ave
- 1867 W 2nd Ave
- 3015 Hillside Ave
- TBD - Lot G Highway 550
- TBD (Tract C) Highway 550
- 49789 Highway 550
- 485 Florida Rd Unit B-15
- 485 Florida Rd Unit C-17
- 12 Falcon Way
- 1201 Main Ave Unit 105
- 1404 E 3rd Ave
- 1330 E 3rd Ave
- 3211 W 2 Nd Ave
- 18 Miller Dr
- 125 W 10th St Unit 104
- 2315 Forest Ave
- 2309 Forest Ave
- 2317 Forest Ave
- 2321 Forest Ave
- 2301 Forest Ave
- 2323 Forest Ave
- 2327 Forest Ave
- 2314 Forest Ave
- 2316 Forest Ave
- 2307 Hermosa Ave
- 2329 Forest Ave
- 2320 Forest Ave
- 2305 Hermosa Ave
- 2322 Forest Ave
- 2333 Forest Ave
- 2326 Forest Ave Unit 19
- 2328 Forest Ave
- 2335 Forest Ave
- 633 Arroyo Dr
- 2303 Hermosa Ave
Your Personal Tour Guide
Ask me questions while you tour the home.