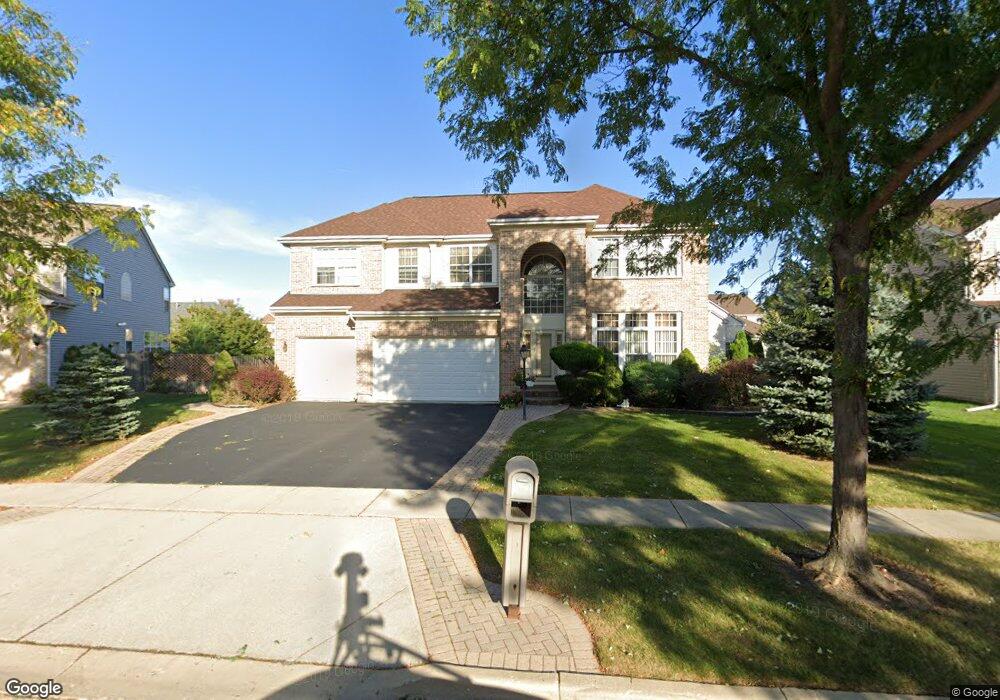
2311 Loop Rd Algonquin, IL 60102
Estimated Value: $519,640 - $601,000
4
Beds
4
Baths
3,386
Sq Ft
$170/Sq Ft
Est. Value
About This Home
This home is located at 2311 Loop Rd, Algonquin, IL 60102 and is currently estimated at $574,410, approximately $169 per square foot. 2311 Loop Rd is a home located in Kane County with nearby schools including Westfield Community School and Harry D Jacobs High School.
Ownership History
Date
Name
Owned For
Owner Type
Purchase Details
Closed on
Jul 23, 2004
Sold by
Lee Young
Bought by
Patel Omprakash and Patel Nayna O
Current Estimated Value
Home Financials for this Owner
Home Financials are based on the most recent Mortgage that was taken out on this home.
Original Mortgage
$324,500
Outstanding Balance
$163,492
Interest Rate
6.35%
Mortgage Type
New Conventional
Estimated Equity
$410,918
Purchase Details
Closed on
Jun 8, 2000
Sold by
Willoughby Farms Ltd Partnership
Bought by
Lee Young
Home Financials for this Owner
Home Financials are based on the most recent Mortgage that was taken out on this home.
Original Mortgage
$247,500
Interest Rate
8.56%
Mortgage Type
Balloon
Create a Home Valuation Report for This Property
The Home Valuation Report is an in-depth analysis detailing your home's value as well as a comparison with similar homes in the area
Purchase History
| Date | Buyer | Sale Price | Title Company |
|---|---|---|---|
| Patel Omprakash | $406,000 | Ticor Title Insurance Co | |
| Lee Young | $329,500 | Stewart Title Company |
Source: Public Records
Mortgage History
| Date | Status | Borrower | Loan Amount |
|---|---|---|---|
| Open | Patel Omprakash | $324,500 | |
| Previous Owner | Lee Young | $247,500 | |
| Closed | Lee Young | $66,000 |
Source: Public Records
Tax History
| Year | Tax Paid | Tax Assessment Tax Assessment Total Assessment is a certain percentage of the fair market value that is determined by local assessors to be the total taxable value of land and additions on the property. | Land | Improvement |
|---|---|---|---|---|
| 2024 | $10,832 | $159,027 | $25,730 | $133,297 |
| 2023 | $7,271 | $143,087 | $23,151 | $119,936 |
| 2022 | $10,227 | $135,151 | $23,151 | $112,000 |
| 2021 | $8,094 | $127,609 | $21,859 | $105,750 |
| 2020 | $8,123 | $124,740 | $21,368 | $103,372 |
| 2019 | $8,319 | $118,417 | $20,285 | $98,132 |
| 2018 | $8,555 | $116,072 | $19,883 | $96,189 |
| 2017 | $8,802 | $108,580 | $18,600 | $89,980 |
| 2016 | $9,825 | $106,362 | $18,009 | $88,353 |
| 2015 | -- | $97,571 | $17,040 | $80,531 |
| 2014 | -- | $90,605 | $16,569 | $74,036 |
| 2013 | -- | $93,378 | $17,076 | $76,302 |
Source: Public Records
Map
Nearby Homes
- 1227 Glenmont St
- 1020 Waterford St
- 2232 Stonegate Rd
- 2238 Stonegate Rd
- 1235 Glenmont St
- 111 Newburgh Ln
- 2252 Stonegate Rd
- 370 Coldsprings St
- 2020 Cosman Way
- 401 Coldsprings St
- 2250 Stonegate Rd
- 2313 Barrett Dr
- 1020 Glenmont St
- 120 Newburgh Ln
- 1090 Glenmont St
- 1111 Glenmont St
- 1080 Glenmont St
- 2254 Stonegate Rd
- 1254 Glenmont St
- 2248 Stonegate Rd
- 2313 Loop Rd
- 2309 Loop Rd Unit 4
- 2316 Poets Ln
- 2320 Poets Ln
- 2312 Poets Ln
- 2307 Loop Rd
- 2312 Loop Rd
- 2324 Poets Ln
- 2315 Loop Rd
- 2308 Poets Ln
- 2328 Poets Ln
- 2305 Loop Rd
- 2317 Loop Rd
- 2304 Poets Ln Unit 3
- 2320 Loop Rd
- 2111 Tracy Ln Unit 4
- 2317 Poets Ln
- 2332 Poets Ln
- 2304 Loop Rd
- 2313 Stonegate Rd Unit 4
Your Personal Tour Guide
Ask me questions while you tour the home.