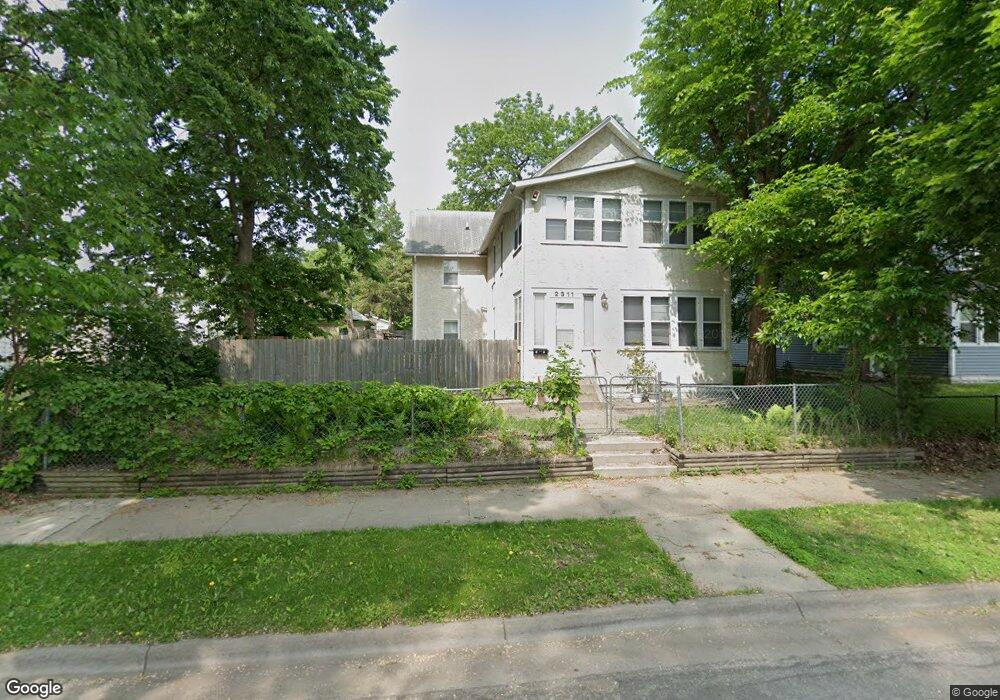
2311 N 4th St Minneapolis, MN 55411
Hawthorne NeighborhoodEstimated Value: $262,000 - $322,000
6
Beds
2
Baths
2,360
Sq Ft
$127/Sq Ft
Est. Value
About This Home
This home is located at 2311 N 4th St, Minneapolis, MN 55411 and is currently estimated at $299,404, approximately $126 per square foot. 2311 N 4th St is a home located in Hennepin County with nearby schools including Nellie Stone Johnson Elementary School, Anwatin Middle School, and North Community High School.
Ownership History
Date
Name
Owned For
Owner Type
Purchase Details
Closed on
Feb 10, 2025
Sold by
Granda-Chacha Jose M
Bought by
Granda Maria L
Current Estimated Value
Purchase Details
Closed on
Jan 25, 2022
Sold by
Kha and Soua
Bought by
Grande Maria L and Granda-Chacha Jose M
Home Financials for this Owner
Home Financials are based on the most recent Mortgage that was taken out on this home.
Original Mortgage
$279,837
Interest Rate
3.55%
Mortgage Type
FHA
Purchase Details
Closed on
Sep 27, 2012
Sold by
Wh Properties Llc
Bought by
Kha Long
Purchase Details
Closed on
Jul 25, 2011
Sold by
Kha Long
Bought by
Wh Properties Llc
Purchase Details
Closed on
Mar 31, 2011
Sold by
Federal National Mortgage Association
Bought by
United States Of America
Purchase Details
Closed on
Aug 5, 2010
Sold by
Loja Martha
Bought by
Chase Home Finance Llc
Purchase Details
Closed on
Nov 16, 2000
Sold by
Sasseville Katherine E
Bought by
Marca Marco
Create a Home Valuation Report for This Property
The Home Valuation Report is an in-depth analysis detailing your home's value as well as a comparison with similar homes in the area
Home Values in the Area
Average Home Value in this Area
Purchase History
| Date | Buyer | Sale Price | Title Company |
|---|---|---|---|
| Granda Maria L | -- | None Listed On Document | |
| Grande Maria L | $285,000 | None Listed On Document | |
| Kha Long | -- | None Available | |
| Wh Properties Llc | -- | None Available | |
| United States Of America | -- | Title One Inc | |
| Chase Home Finance Llc | $141,622 | -- | |
| Marca Marco | $103,500 | -- |
Source: Public Records
Mortgage History
| Date | Status | Borrower | Loan Amount |
|---|---|---|---|
| Previous Owner | Grande Maria L | $279,837 |
Source: Public Records
Tax History Compared to Growth
Tax History
| Year | Tax Paid | Tax Assessment Tax Assessment Total Assessment is a certain percentage of the fair market value that is determined by local assessors to be the total taxable value of land and additions on the property. | Land | Improvement |
|---|---|---|---|---|
| 2024 | $4,328 | $308,000 | $18,000 | $290,000 |
| 2023 | $4,367 | $273,000 | $15,000 | $258,000 |
| 2022 | $2,411 | $226,000 | $15,000 | $211,000 |
| 2021 | $2,057 | $192,000 | $13,000 | $179,000 |
| 2020 | $1,955 | $173,000 | $13,500 | $159,500 |
| 2019 | $1,754 | $153,000 | $9,000 | $144,000 |
| 2018 | $1,403 | $136,500 | $9,000 | $127,500 |
| 2017 | $1,443 | $114,500 | $8,200 | $106,300 |
| 2016 | $1,595 | $120,500 | $8,200 | $112,300 |
| 2015 | $1,273 | $100,500 | $8,200 | $92,300 |
| 2014 | -- | $95,500 | $9,700 | $85,800 |
Source: Public Records
Map
Nearby Homes
- 2407 N 4th St
- 306 23rd Ave N
- 2410 Lyndale Ave N
- 1900 5th St N
- 2718 N 4th St
- 2214 Dupont Ave N
- 1814 New York Ave N
- 2323 Dupont Ave N
- 2634 Colfax Ave N
- 2704 Bryant Ave N
- 2806 Aldrich Ave N
- 2630 Dupont Ave N
- 2323 Emerson Ave N
- 2800 Bryant Ave N
- 1105 25th Ave N
- 2124 Fremont Ave N
- 2906 Bryant Ave N
- 2217 Fremont Ave N
- 2905 Bryant Ave N
- 2913 Bryant Ave N
- 2313 N 4th St
- 2301 N 4th St
- 412 23rd Ave N
- 2317 N 4th St
- 418 23rd Ave N
- 414 23rd Ave N
- 413 24th Ave N
- 2321 N 4th St
- 418 418 23rd-Avenue-n
- 2308 N 6th St
- 415 24th Ave N
- 2312 N 6th St
- 2318 N 6th St
- 2312 2312 6th-Street-n
- 405 23rd Ave N
- 2306 N 6th St
- 2310 N 4th St
- 2310 2310 4th-Street-n
- 426 23rd Ave N
- 2314 N 4th St