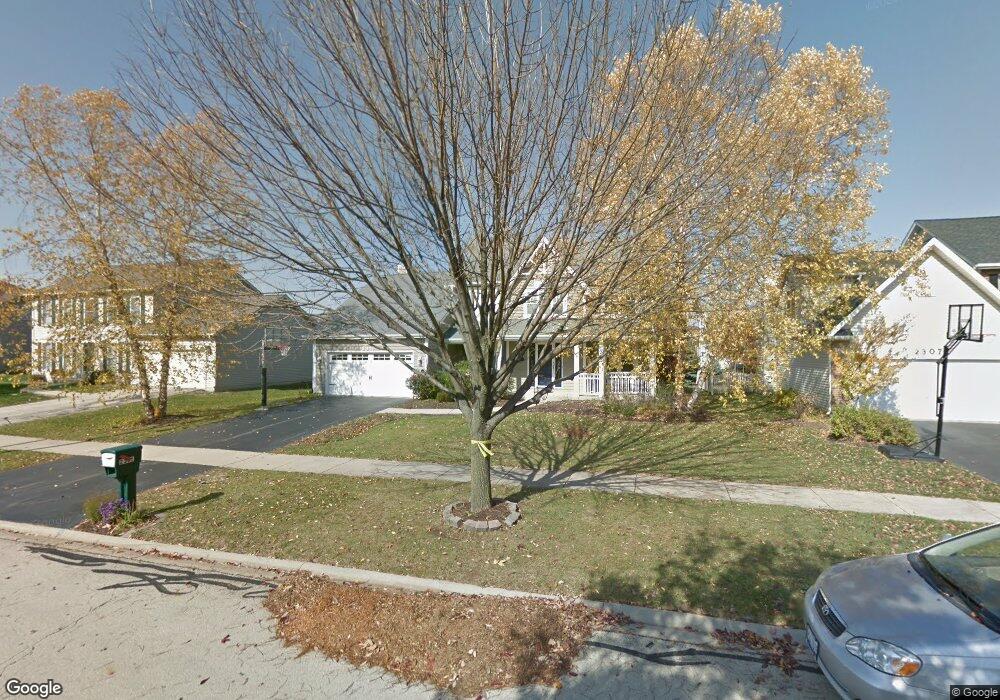
2311 Spike Horn Ave Naperville, IL 60564
Saddle Creek NeighborhoodEstimated Value: $674,046 - $733,000
4
Beds
3
Baths
2,722
Sq Ft
$260/Sq Ft
Est. Value
About This Home
This home is located at 2311 Spike Horn Ave, Naperville, IL 60564 and is currently estimated at $708,012, approximately $260 per square foot. 2311 Spike Horn Ave is a home located in Will County with nearby schools including Oliver Julian Kendall Elementary School, Ellsworth Elementary School, and Clifford Crone Middle School.
Ownership History
Date
Name
Owned For
Owner Type
Purchase Details
Closed on
May 24, 2017
Sold by
Cichy Julie L and Zimmerman Mark W
Bought by
Sultan Hatem
Current Estimated Value
Home Financials for this Owner
Home Financials are based on the most recent Mortgage that was taken out on this home.
Original Mortgage
$403,655
Outstanding Balance
$335,042
Interest Rate
4.03%
Mortgage Type
New Conventional
Estimated Equity
$372,970
Purchase Details
Closed on
Aug 7, 2009
Sold by
Cotter Kenneth J and Cotter Karen S
Bought by
Cichy Julie L
Purchase Details
Closed on
Jun 3, 1996
Sold by
Tom Bart Construction Inc
Bought by
Cotter Kenneth J and Cotter Karen S
Home Financials for this Owner
Home Financials are based on the most recent Mortgage that was taken out on this home.
Original Mortgage
$197,880
Interest Rate
7.97%
Mortgage Type
Balloon
Create a Home Valuation Report for This Property
The Home Valuation Report is an in-depth analysis detailing your home's value as well as a comparison with similar homes in the area
Home Values in the Area
Average Home Value in this Area
Purchase History
| Date | Buyer | Sale Price | Title Company |
|---|---|---|---|
| Sultan Hatem | $424,900 | First American Title | |
| Cichy Julie L | $415,000 | Atg | |
| Cotter Kenneth J | $247,500 | Chicago Title Insurance Co | |
| Tom Bart Construction Inc | $60,000 | Chicago Title Insurance Co |
Source: Public Records
Mortgage History
| Date | Status | Borrower | Loan Amount |
|---|---|---|---|
| Open | Sultan Hatem | $403,655 | |
| Previous Owner | Cotter Kenneth J | $197,880 |
Source: Public Records
Tax History Compared to Growth
Tax History
| Year | Tax Paid | Tax Assessment Tax Assessment Total Assessment is a certain percentage of the fair market value that is determined by local assessors to be the total taxable value of land and additions on the property. | Land | Improvement |
|---|---|---|---|---|
| 2024 | $12,470 | $198,385 | $44,186 | $154,199 |
| 2023 | $12,470 | $175,252 | $39,034 | $136,218 |
| 2022 | $10,676 | $153,351 | $36,925 | $116,426 |
| 2021 | $10,201 | $146,049 | $35,167 | $110,882 |
| 2020 | $10,007 | $143,735 | $34,610 | $109,125 |
| 2019 | $9,834 | $139,685 | $33,635 | $106,050 |
| 2018 | $9,644 | $134,741 | $32,895 | $101,846 |
| 2017 | $10,103 | $139,284 | $32,046 | $107,238 |
| 2016 | $10,083 | $136,286 | $31,356 | $104,930 |
| 2015 | $9,579 | $131,044 | $30,150 | $100,894 |
| 2014 | $9,579 | $122,445 | $30,150 | $92,295 |
| 2013 | $9,579 | $122,445 | $30,150 | $92,295 |
Source: Public Records
Map
Nearby Homes
- 2711 Wait Rd
- 2255 Wendt Cir
- 1736 Robert Ln
- 1804 Princess Cir
- 26106 W Sherwood Cir
- 23234 W Allagash Dr
- 2419 Lawlor Ln
- 2519 Mallet Ct
- 24024 W Champion Dr
- 2539 Mallet Ct
- 2423 Lawlor Ln
- 2543 Mallet Ct
- 2547 Mallet Ct
- 29W316 Andermann Dr
- 2427 Lawlor Ln
- 2607 Lawlor Ln
- 2611 Lawlor Ln
- 2547 Tailshot Rd
- 5911 Hawkweed Dr Unit 8705
- 2318 Horseshoe Cir Unit 8802
- 2307 Spike Horn Ave
- 2315 Spike Horn Ave
- 4812 Clearwater Ln
- 2319 Spike Horn Ave
- 4808 Clearwater Ln Unit LM
- 4816 Clearwater Ln
- 2303 Spike Horn Ave
- 2312 Spike Horn Ave
- 2316 Spike Horn Ave
- 4804 Clearwater Ln
- 2308 Spike Horn Ave Unit 2
- 2323 Spike Horn Ave
- 2320 Spike Horn Ave
- 2304 Spike Horn Ave
- 4824 Clearwater Ln
- 2324 Spike Horn Ave
- 2327 Spike Horn Ave
- 4828 Clearwater Ln
- 2311 Kentuck Ct Unit 2
- 2315 Kentuck Ct Unit 2