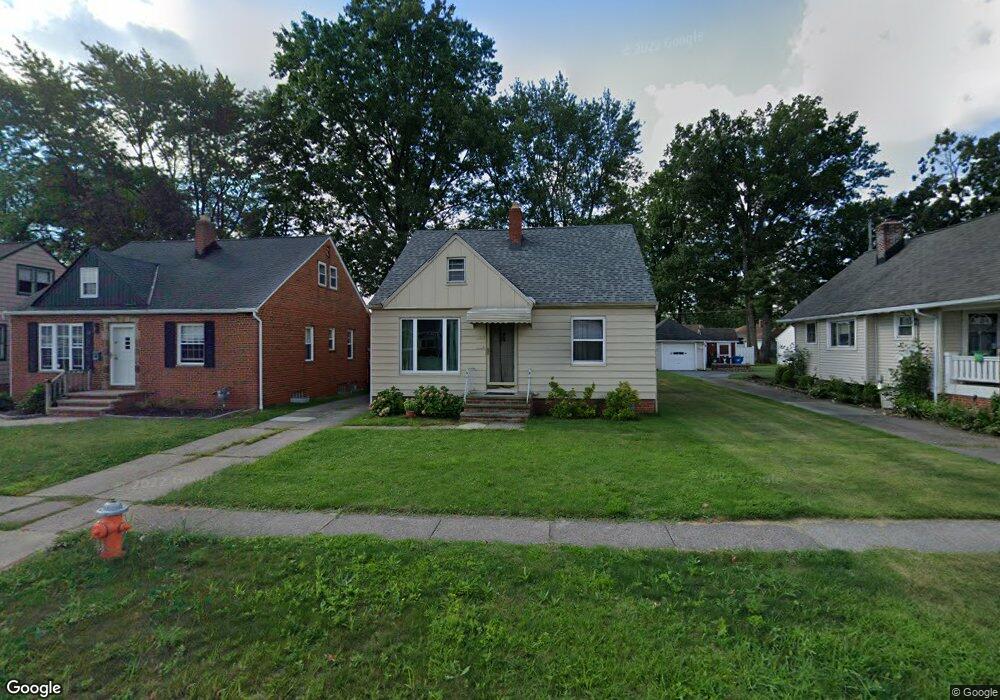
2311 Tuxedo Ave Cleveland, OH 44134
Estimated Value: $153,000 - $204,000
2
Beds
1
Bath
896
Sq Ft
$191/Sq Ft
Est. Value
About This Home
This home is located at 2311 Tuxedo Ave, Cleveland, OH 44134 and is currently estimated at $171,067, approximately $190 per square foot. 2311 Tuxedo Ave is a home located in Cuyahoga County with nearby schools including John Muir Elementary School, Shiloh Middle School, and Parma High School.
Ownership History
Date
Name
Owned For
Owner Type
Purchase Details
Closed on
Mar 9, 2011
Sold by
Hsbc Bank Usa National Association
Bought by
Kos Vasyl
Current Estimated Value
Purchase Details
Closed on
Dec 30, 2010
Sold by
Jedrick Constance M
Bought by
Hsbc Bank Usa National Association
Purchase Details
Closed on
Jan 25, 2007
Sold by
Cifranic Margaret
Bought by
Jedrick Constance M
Home Financials for this Owner
Home Financials are based on the most recent Mortgage that was taken out on this home.
Original Mortgage
$85,000
Interest Rate
9.95%
Mortgage Type
Purchase Money Mortgage
Purchase Details
Closed on
Mar 12, 1993
Sold by
John Cifranic
Bought by
Cifranic Margaret
Purchase Details
Closed on
Feb 11, 1980
Sold by
Cifranic John and Cifranic Margaret
Bought by
John Cifranic
Purchase Details
Closed on
Jan 1, 1975
Bought by
Cifranic John and Cifranic Margaret
Create a Home Valuation Report for This Property
The Home Valuation Report is an in-depth analysis detailing your home's value as well as a comparison with similar homes in the area
Home Values in the Area
Average Home Value in this Area
Purchase History
| Date | Buyer | Sale Price | Title Company |
|---|---|---|---|
| Kos Vasyl | $27,000 | Accutitle Agency | |
| Hsbc Bank Usa National Association | $22,000 | None Available | |
| Jedrick Constance M | $85,000 | Patriot | |
| Cifranic Margaret | -- | -- | |
| John Cifranic | -- | -- | |
| Cifranic John | -- | -- |
Source: Public Records
Mortgage History
| Date | Status | Borrower | Loan Amount |
|---|---|---|---|
| Previous Owner | Jedrick Constance M | $85,000 |
Source: Public Records
Tax History Compared to Growth
Tax History
| Year | Tax Paid | Tax Assessment Tax Assessment Total Assessment is a certain percentage of the fair market value that is determined by local assessors to be the total taxable value of land and additions on the property. | Land | Improvement |
|---|---|---|---|---|
| 2024 | $2,975 | $46,865 | $10,955 | $35,910 |
| 2023 | $2,687 | $36,410 | $9,000 | $27,410 |
| 2022 | $2,661 | $36,400 | $9,000 | $27,410 |
| 2021 | $2,738 | $36,400 | $9,000 | $27,410 |
| 2020 | $2,401 | $28,000 | $6,930 | $21,070 |
| 2019 | $2,295 | $80,000 | $19,800 | $60,200 |
| 2018 | $2,119 | $28,000 | $6,930 | $21,070 |
| 2017 | $2,088 | $23,420 | $5,220 | $18,200 |
| 2016 | $2,076 | $23,420 | $5,220 | $18,200 |
| 2015 | $3,059 | $23,420 | $5,220 | $18,200 |
| 2014 | $3,059 | $23,910 | $5,320 | $18,590 |
Source: Public Records
Map
Nearby Homes
- 2129 North Ave
- 2302 Brookdale Ave
- 2503 Brookdale Ave
- 1716 Tuxedo Ave
- 2923 Brookview Blvd
- 2923 Brookdale Ave
- 3000 Brookpark Rd Unit R10
- 3107 Brookdale Ave
- 5231 W 16th St
- 2137 Silverdale Ave
- 3323 North Ave
- 3019 Torrington Ave
- 2831 Walbrook Ave
- 3402 North Ave
- 5553 Sunset Ln Unit A15-F
- 3430 Brookview Blvd
- 2712 Ralph Ave
- 3310 Walbrook Ave
- 5432 State Rd
- 5554 Landover Ct Unit 282
- 2307 Tuxedo Ave
- 2319 Tuxedo Ave
- 2303 Tuxedo Ave
- 2321 Tuxedo Ave
- 2323 Tuxedo Ave
- 2314 Russell Ave
- 2225 Tuxedo Ave
- 2327 Tuxedo Ave
- 2304 Russell Ave
- 2320 Russell Ave
- 2324 Russell Ave
- 2300 Russell Ave
- 2221 Tuxedo Ave
- 2314 Tuxedo Ave
- 2226 Russell Ave
- 2316 Tuxedo Ave
- 2310 Tuxedo Ave
- 2318 Tuxedo Ave
- 2328 Russell Ave
- 2322 Tuxedo Ave