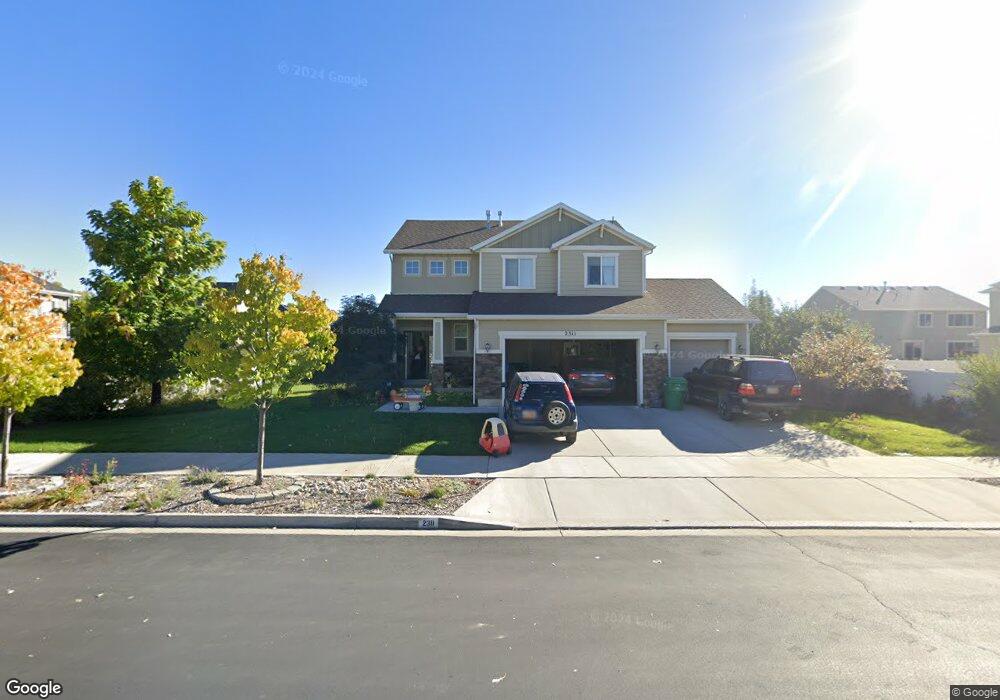
2311 W 440 S Unit 23 Provo, UT 84601
Franklin NeighborhoodEstimated Value: $567,000 - $678,000
5
Beds
3
Baths
2,119
Sq Ft
$290/Sq Ft
Est. Value
About This Home
This home is located at 2311 W 440 S Unit 23, Provo, UT 84601 and is currently estimated at $614,563, approximately $290 per square foot. 2311 W 440 S Unit 23 is a home located in Utah County with nearby schools including Dixon Middle School, Provo High School, and Freedom Preparatory Academy.
Ownership History
Date
Name
Owned For
Owner Type
Purchase Details
Closed on
Sep 17, 2013
Sold by
Candlelight Homes Llc
Bought by
Christensen Nathan J and Christensen Victoria E
Current Estimated Value
Home Financials for this Owner
Home Financials are based on the most recent Mortgage that was taken out on this home.
Original Mortgage
$223,000
Outstanding Balance
$166,146
Interest Rate
4.36%
Mortgage Type
New Conventional
Estimated Equity
$448,417
Purchase Details
Closed on
Dec 12, 2012
Sold by
Dumatt Development Lc
Bought by
Candlelight Homes Llc
Home Financials for this Owner
Home Financials are based on the most recent Mortgage that was taken out on this home.
Original Mortgage
$167,760
Interest Rate
3.35%
Mortgage Type
Construction
Purchase Details
Closed on
Feb 13, 2009
Sold by
Americraft Homes Inc
Bought by
Central Bank
Create a Home Valuation Report for This Property
The Home Valuation Report is an in-depth analysis detailing your home's value as well as a comparison with similar homes in the area
Home Values in the Area
Average Home Value in this Area
Purchase History
| Date | Buyer | Sale Price | Title Company |
|---|---|---|---|
| Christensen Nathan J | -- | Advanced Title Q | |
| Candlelight Homes Llc | -- | Advanced Land Title | |
| Central Bank | $1,980,000 | Pro Title & Escrow Inc |
Source: Public Records
Mortgage History
| Date | Status | Borrower | Loan Amount |
|---|---|---|---|
| Open | Christensen Nathan J | $223,000 | |
| Previous Owner | Candlelight Homes Llc | $167,760 |
Source: Public Records
Tax History Compared to Growth
Tax History
| Year | Tax Paid | Tax Assessment Tax Assessment Total Assessment is a certain percentage of the fair market value that is determined by local assessors to be the total taxable value of land and additions on the property. | Land | Improvement |
|---|---|---|---|---|
| 2025 | $2,740 | $313,225 | $228,700 | $340,800 |
| 2024 | $2,740 | $269,720 | $0 | $0 |
| 2023 | $2,681 | $260,150 | $0 | $0 |
| 2022 | $2,769 | $270,930 | $0 | $0 |
| 2021 | $2,169 | $370,100 | $129,000 | $241,100 |
| 2020 | $2,084 | $333,400 | $112,200 | $221,200 |
| 2019 | $1,835 | $305,300 | $112,200 | $193,100 |
| 2018 | $1,745 | $294,400 | $101,300 | $193,100 |
| 2017 | $1,704 | $157,960 | $0 | $0 |
| 2016 | $1,735 | $149,985 | $0 | $0 |
| 2015 | $1,505 | $131,450 | $0 | $0 |
| 2014 | $1,351 | $128,370 | $0 | $0 |
Source: Public Records
Map
Nearby Homes
- 386 S 2390 W
- 312 S 1920 W
- 273 S 1860 W
- 1828 W 170 S
- 201 N Geneva Rd Unit 3
- 227 West Ln
- 154 N 2560 W
- 147 S 1680 W
- 2744 W 50 N
- 249 West Ln Unit 10
- 2727 W 220 N
- 1744 W 150 N
- 1075 Lakeview Pkwy
- 1125 Lakeview Pkwy
- 392 N 2150 W
- 398 N 2380 W
- 255 N 1600 W Unit 148
- 255 N 1600 W Unit 52
- 255 N 1600 W Unit 84
- 255 N 1600 W Unit 108
- 2311 W 440 S
- 2312 W 490 S
- 462 S 2280 W
- 461 S 2330 W
- 474 S 2280 W Unit 25
- 474 S 2280 W
- 2326 W 490 S
- 2316 W 440 S Unit 9
- 2316 W 440 S
- 2304 W 440 S Unit 10
- 2328 W 440 S Unit 8
- 2313 W 490 S
- 496 S 2280 W Unit 26
- 496 S 2280 W
- 2292 W 440 S Unit 11
- 453 S 2280 W
- 518 S 2280 W Unit 27
- 518 S 2280 W
- 472 S 2330 W Unit 5
- 2327 W 490 S