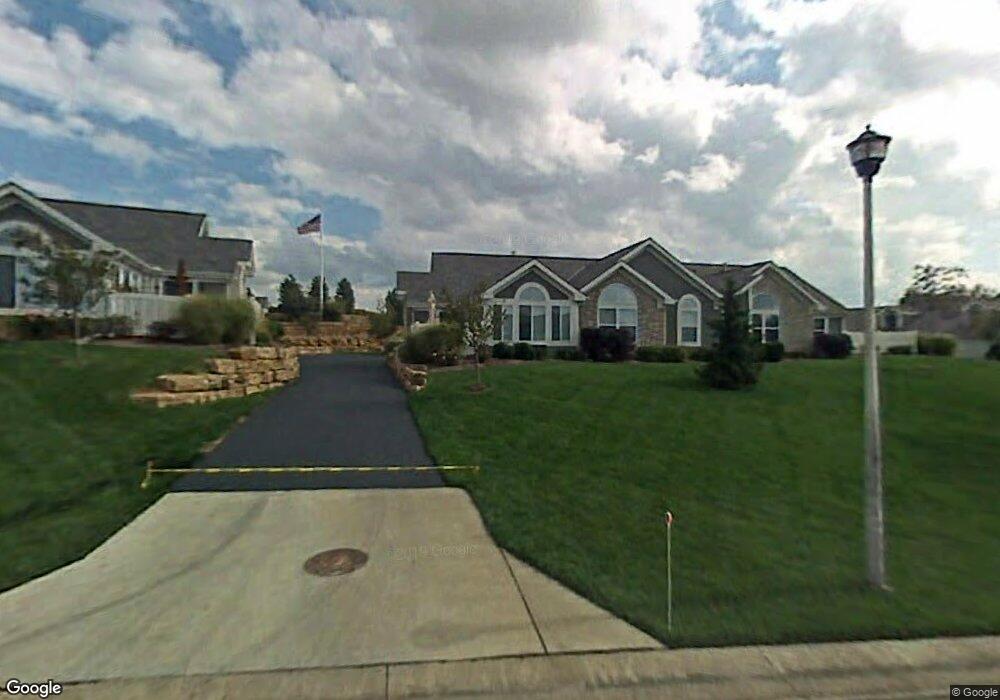
23118 W 71st Terrace Shawnee, KS 66227
Estimated Value: $392,000 - $415,933
3
Beds
2
Baths
1,736
Sq Ft
$231/Sq Ft
Est. Value
About This Home
This home is located at 23118 W 71st Terrace, Shawnee, KS 66227 and is currently estimated at $401,733, approximately $231 per square foot. 23118 W 71st Terrace is a home located in Johnson County with nearby schools including Mize Elementary School, Mill Creek Middle School, and De Soto High School.
Ownership History
Date
Name
Owned For
Owner Type
Purchase Details
Closed on
Sep 29, 2020
Sold by
Stapp Cynthia Lynne
Bought by
Knapp Bruce L and Stapp Cynthia Lynne
Current Estimated Value
Purchase Details
Closed on
Oct 16, 2006
Sold by
Komar Sheryl Ann and Nelson Marianne
Bought by
Stapp Cynthia Lynne
Home Financials for this Owner
Home Financials are based on the most recent Mortgage that was taken out on this home.
Original Mortgage
$137,500
Interest Rate
6.17%
Mortgage Type
New Conventional
Purchase Details
Closed on
Jul 26, 2004
Sold by
Town & Country Villas Llc
Bought by
Nelson Marianne
Home Financials for this Owner
Home Financials are based on the most recent Mortgage that was taken out on this home.
Original Mortgage
$168,760
Interest Rate
6.3%
Mortgage Type
Purchase Money Mortgage
Create a Home Valuation Report for This Property
The Home Valuation Report is an in-depth analysis detailing your home's value as well as a comparison with similar homes in the area
Home Values in the Area
Average Home Value in this Area
Purchase History
| Date | Buyer | Sale Price | Title Company |
|---|---|---|---|
| Knapp Bruce L | -- | None Available | |
| Stapp Cynthia Lynne | -- | Chicago Title Ins Co | |
| Nelson Marianne | -- | Columbian Title |
Source: Public Records
Mortgage History
| Date | Status | Borrower | Loan Amount |
|---|---|---|---|
| Closed | Stapp Cynthia Lynne | $137,500 | |
| Previous Owner | Nelson Marianne | $168,760 |
Source: Public Records
Tax History Compared to Growth
Tax History
| Year | Tax Paid | Tax Assessment Tax Assessment Total Assessment is a certain percentage of the fair market value that is determined by local assessors to be the total taxable value of land and additions on the property. | Land | Improvement |
|---|---|---|---|---|
| 2024 | $4,725 | $40,768 | $5,750 | $35,018 |
| 2023 | $4,546 | $38,698 | $5,750 | $32,948 |
| 2022 | $3,994 | $33,316 | $5,003 | $28,313 |
| 2021 | $4,122 | $32,983 | $4,543 | $28,440 |
| 2020 | $4,048 | $32,097 | $4,543 | $27,554 |
| 2019 | $3,908 | $30,533 | $4,106 | $26,427 |
| 2018 | $3,704 | $28,670 | $4,106 | $24,564 |
| 2017 | $3,620 | $27,336 | $3,565 | $23,771 |
| 2016 | $3,451 | $25,737 | $3,565 | $22,172 |
| 2015 | $3,375 | $24,783 | $3,565 | $21,218 |
| 2013 | -- | $21,321 | $3,565 | $17,756 |
Source: Public Records
Map
Nearby Homes
- 23136 W 71st Terrace
- 7153 Meadow View St
- 23154 W 71st Terrace
- 23217 W 71st Terrace
- 7101 Meadow View St
- 7134 Hedge Lane Terrace
- 22707 W 73rd St
- 7323 Meadowsweet Ln
- 23300 W 71st St
- 7342 Mccoy St
- 0 Hedge Lane Terrace
- 9309 Aminda St
- 7512 Mccoy St
- 00 75th St
- 000 75th St
- 0000 75th St
- 22410 W 76th St
- 7005 Barth Rd
- 22408 W 76th St
- 22312 W 76th St
- 23112 W 71st Terrace
- 23114 W 71st Terrace
- 23122 W 71st Terrace
- 23124 W 71st Terrace
- 23128 W 71st Terrace
- 23106 W 71st Terrace
- 23108 W 71st Terrace
- 23126 W 71st Terrace
- 23104 W 71st Terrace
- 23102 W 71st Terrace
- 23117 W 71st Terrace
- 23111 W 71st Terrace
- 23115 W 71st Terrace
- 23132 W 71st Terrace
- 23131 W 71st Terrace
- 7211 Meadow View St
- 23134 W 71st Terrace
- 23113 W 71st Terrace
- 7213 Meadow View St
- 23138 W 71st Terrace