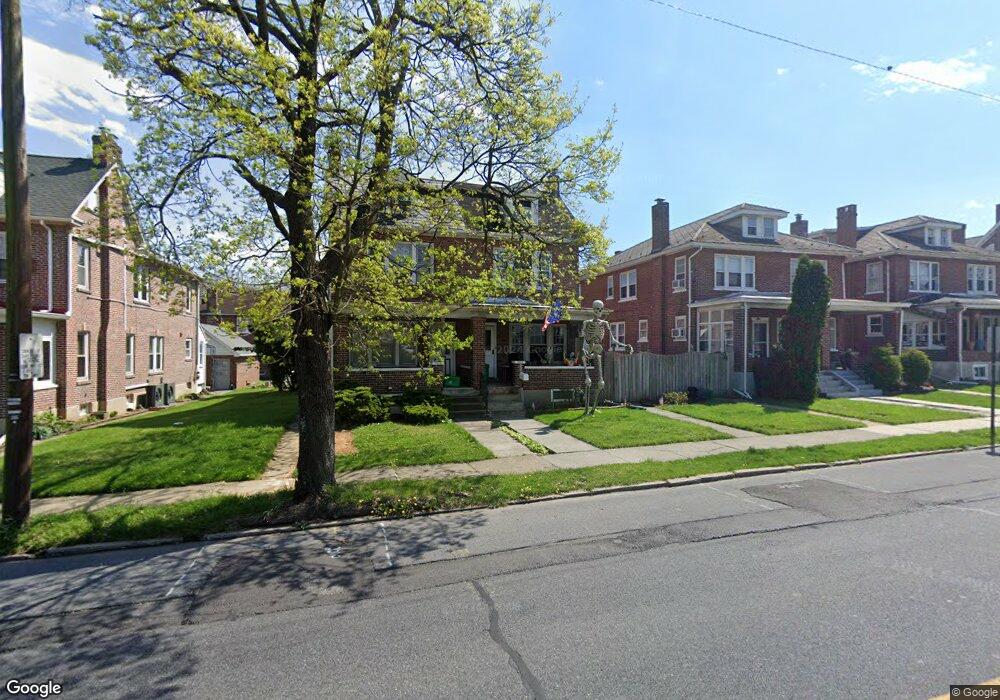
2312 W Tilghman St Allentown, PA 18104
West End Allentown NeighborhoodEstimated Value: $251,000 - $326,000
3
Beds
1
Bath
1,440
Sq Ft
$196/Sq Ft
Est. Value
About This Home
This home is located at 2312 W Tilghman St, Allentown, PA 18104 and is currently estimated at $281,752, approximately $195 per square foot. 2312 W Tilghman St is a home located in Lehigh County with nearby schools including Muhlenberg Elementary School, San Rafael Junior High School, and Trexler Middle School.
Ownership History
Date
Name
Owned For
Owner Type
Purchase Details
Closed on
Nov 29, 2005
Sold by
Hud
Bought by
Tam Kevin R
Current Estimated Value
Home Financials for this Owner
Home Financials are based on the most recent Mortgage that was taken out on this home.
Original Mortgage
$118,320
Outstanding Balance
$65,728
Interest Rate
6.17%
Mortgage Type
Purchase Money Mortgage
Estimated Equity
$216,024
Purchase Details
Closed on
Aug 29, 2005
Sold by
M & T Mortgage Corp
Bought by
Hud
Purchase Details
Closed on
Dec 7, 2004
Sold by
Vasquez Tina and Clintron Tina
Bought by
M & T Mortgage Corp
Purchase Details
Closed on
May 3, 2002
Sold by
Jones Shawn M and Jones Maria D C
Bought by
Vasquez Tina
Home Financials for this Owner
Home Financials are based on the most recent Mortgage that was taken out on this home.
Original Mortgage
$89,195
Interest Rate
7.01%
Mortgage Type
FHA
Purchase Details
Closed on
Oct 20, 1997
Sold by
Reidy Carl E and Reidy Lillian M
Bought by
Jones Shawn M and Figueroa Maria D C
Create a Home Valuation Report for This Property
The Home Valuation Report is an in-depth analysis detailing your home's value as well as a comparison with similar homes in the area
Home Values in the Area
Average Home Value in this Area
Purchase History
| Date | Buyer | Sale Price | Title Company |
|---|---|---|---|
| Tam Kevin R | $147,900 | None Available | |
| Hud | -- | None Available | |
| M & T Mortgage Corp | -- | -- | |
| Vasquez Tina | $89,900 | First American Title Insuran | |
| Jones Shawn M | $75,000 | -- |
Source: Public Records
Mortgage History
| Date | Status | Borrower | Loan Amount |
|---|---|---|---|
| Open | Tam Kevin R | $118,320 | |
| Previous Owner | Vasquez Tina | $89,195 |
Source: Public Records
Tax History Compared to Growth
Tax History
| Year | Tax Paid | Tax Assessment Tax Assessment Total Assessment is a certain percentage of the fair market value that is determined by local assessors to be the total taxable value of land and additions on the property. | Land | Improvement |
|---|---|---|---|---|
| 2025 | $3,976 | $120,600 | $13,200 | $107,400 |
| 2024 | $3,976 | $120,600 | $13,200 | $107,400 |
| 2023 | $3,976 | $120,600 | $13,200 | $107,400 |
| 2022 | $3,838 | $120,600 | $107,400 | $13,200 |
| 2021 | $3,763 | $120,600 | $13,200 | $107,400 |
| 2020 | $3,666 | $120,600 | $13,200 | $107,400 |
| 2019 | $3,607 | $120,600 | $13,200 | $107,400 |
| 2018 | $3,359 | $120,600 | $13,200 | $107,400 |
| 2017 | $3,275 | $120,600 | $13,200 | $107,400 |
| 2016 | -- | $120,600 | $13,200 | $107,400 |
| 2015 | -- | $120,600 | $13,200 | $107,400 |
| 2014 | -- | $120,600 | $13,200 | $107,400 |
Source: Public Records
Map
Nearby Homes
- 614 N 23rd St
- 525 N Leh St
- 2133 W Gordon St Unit 2135
- 2140 W Gordon St
- 2023 W Washington St
- 2150 W Livingston St
- 615 N 27th St
- 737 N 27th St
- 921 N 26th St
- 2403 W Tremont St
- 2702-2710 Liberty St Unit 2702
- 514 N Broad St Unit 520
- 1017 N 21st St
- 2626 W Livingston St Unit 2636
- 2328 W Congress St
- 917 N Broad St Unit 925
- 1135 N 23rd St
- 518 N Saint George St
- 525 N Main St Unit 527
- 2014 W Highland St
- 2314 W Tilghman St
- 2310 W Tilghman St
- 2316 W Tilghman St
- 2308 W Tilghman St
- 2318 W Tilghman St
- 2306 W Tilghman St
- 2320 W Tilghman St
- 630 N 23rd St
- 2322 W Tilghman St
- 628 N 23rd St
- 629 N Berks St
- 2324 W Tilghman St
- 624 N 23rd St Unit 626
- 627 N Berks St
- 622 N 23rd St
- 625 N Berks St
- 2315 W Tilghman St
- 2317 W Tilghman St
- 620 N 23rd St
- 623 N Berks St