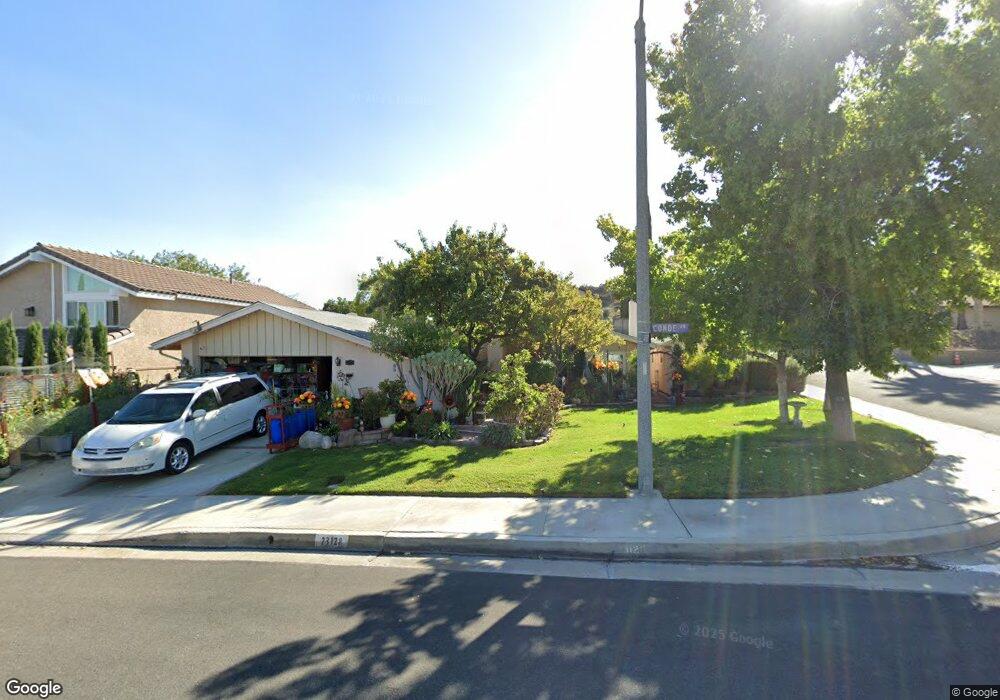
23128 Conde Dr Valencia, CA 91354
Estimated Value: $807,538 - $870,000
4
Beds
2
Baths
1,960
Sq Ft
$432/Sq Ft
Est. Value
About This Home
This home is located at 23128 Conde Dr, Valencia, CA 91354 and is currently estimated at $846,135, approximately $431 per square foot. 23128 Conde Dr is a home located in Los Angeles County with nearby schools including Santa Clarita Elementary School, Arroyo Seco Junior High School, and Saugus High School.
Ownership History
Date
Name
Owned For
Owner Type
Purchase Details
Closed on
Apr 27, 2006
Sold by
Lasky Aron A
Bought by
Lasky Aron A and Lasky Ioene R
Current Estimated Value
Purchase Details
Closed on
Oct 6, 1998
Sold by
Lasky Aron
Bought by
Lasky Aron A
Home Financials for this Owner
Home Financials are based on the most recent Mortgage that was taken out on this home.
Original Mortgage
$185,000
Outstanding Balance
$39,840
Interest Rate
6.71%
Estimated Equity
$806,295
Purchase Details
Closed on
Dec 10, 1997
Sold by
Farmer Katherine Trust
Bought by
Lasky Aron and Lasky Irma
Home Financials for this Owner
Home Financials are based on the most recent Mortgage that was taken out on this home.
Original Mortgage
$181,750
Interest Rate
7.16%
Purchase Details
Closed on
Mar 26, 1996
Sold by
Farmer Katharine
Bought by
Farmer Katharine and Katharine Farmer Trust
Create a Home Valuation Report for This Property
The Home Valuation Report is an in-depth analysis detailing your home's value as well as a comparison with similar homes in the area
Home Values in the Area
Average Home Value in this Area
Purchase History
| Date | Buyer | Sale Price | Title Company |
|---|---|---|---|
| Lasky Aron A | -- | None Available | |
| Lasky Aron A | -- | United Title Company | |
| Lasky Aron | $202,000 | Investors Title Company | |
| Farmer Katharine | -- | -- |
Source: Public Records
Mortgage History
| Date | Status | Borrower | Loan Amount |
|---|---|---|---|
| Open | Lasky Aron A | $185,000 | |
| Closed | Lasky Aron | $181,750 |
Source: Public Records
Tax History Compared to Growth
Tax History
| Year | Tax Paid | Tax Assessment Tax Assessment Total Assessment is a certain percentage of the fair market value that is determined by local assessors to be the total taxable value of land and additions on the property. | Land | Improvement |
|---|---|---|---|---|
| 2025 | $4,684 | $322,514 | $116,227 | $206,287 |
| 2024 | $4,684 | $316,192 | $113,949 | $202,243 |
| 2023 | $4,541 | $309,993 | $111,715 | $198,278 |
| 2022 | $4,553 | $303,916 | $109,525 | $194,391 |
| 2021 | $4,471 | $297,958 | $107,378 | $190,580 |
| 2019 | $4,315 | $289,122 | $104,194 | $184,928 |
| 2018 | $4,166 | $283,453 | $102,151 | $181,302 |
| 2016 | $3,916 | $272,449 | $98,186 | $174,263 |
| 2015 | $3,770 | $268,358 | $96,712 | $171,646 |
| 2014 | $3,710 | $263,102 | $94,818 | $168,284 |
Source: Public Records
Map
Nearby Homes
- 23141 La Granja Dr
- 23132 Posada Dr
- 23054 La Granja Dr
- 27139 Vista Encantada Dr
- 23422 Westford Place
- 26963 Hillsborough Pkwy Unit 71
- 26967 Hillsborough Pkwy Unit 77
- 27100 Sanford Way
- 22810 Rio Chico Dr
- 26861 Cuatro Milpas St
- 26925 Hillsborough Pkwy Unit 96
- 26927 Cuatro Milpas St
- 26953 Cuatro Milpas St
- 23321 Beachcomber Ln
- 22725 Garzota Dr
- 26951 Hillsborough Pkwy Unit 47
- 22903 Vista Delgado Dr
- 27251 Blakely Place
- 27021 Rio Bosque Dr
- 23402 Brookdale Ln Unit 56
- 23116 Conde Dr
- 23133 La Granja Dr
- 26979 Grajuelo Dr
- 23129 Conde Dr
- 26971 Grajuelo Dr
- 23123 Conde Dr
- 23127 La Granja Dr
- 23137 Conde Dr
- 23108 Conde Dr
- 26963 Grajuelo Dr
- 23117 Conde Dr
- 23119 La Granja Dr
- 23213 Conde Dr
- 23222 Nido Ct
- 23109 Conde Dr
- 23102 Conde Dr
- 23128 Cerca Dr
- 23120 Cerca Dr
- 23142 La Granja Dr
- 23228 Nido Ct