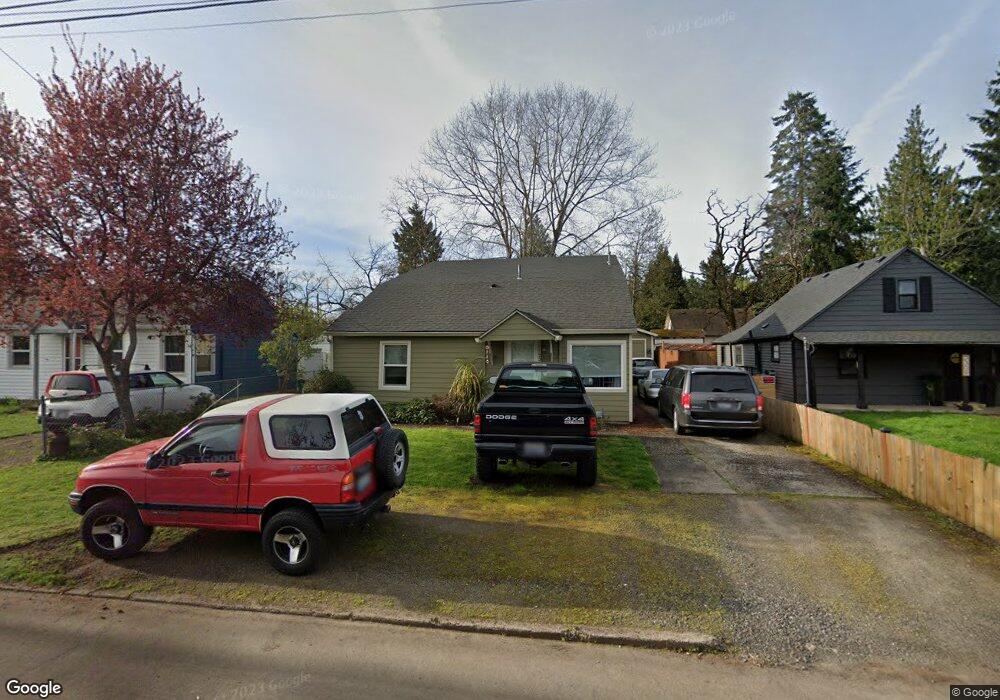
2313 E 26th St Vancouver, WA 98661
Rose Village NeighborhoodEstimated Value: $424,000 - $435,000
3
Beds
1
Bath
1,566
Sq Ft
$274/Sq Ft
Est. Value
About This Home
This home is located at 2313 E 26th St, Vancouver, WA 98661 and is currently estimated at $429,489, approximately $274 per square foot. 2313 E 26th St is a home located in Clark County with nearby schools including Harney Elementary School, Discovery Middle School, and Hudson's Bay High School.
Ownership History
Date
Name
Owned For
Owner Type
Purchase Details
Closed on
Aug 19, 1998
Sold by
Milgrove Kent Daniel
Bought by
Skidgel William R
Current Estimated Value
Home Financials for this Owner
Home Financials are based on the most recent Mortgage that was taken out on this home.
Original Mortgage
$92,150
Outstanding Balance
$56,486
Interest Rate
6.5%
Estimated Equity
$373,003
Create a Home Valuation Report for This Property
The Home Valuation Report is an in-depth analysis detailing your home's value as well as a comparison with similar homes in the area
Home Values in the Area
Average Home Value in this Area
Purchase History
| Date | Buyer | Sale Price | Title Company |
|---|---|---|---|
| Skidgel William R | $97,000 | Transnation Title Insurance |
Source: Public Records
Mortgage History
| Date | Status | Borrower | Loan Amount |
|---|---|---|---|
| Open | Skidgel William R | $92,150 |
Source: Public Records
Tax History
| Year | Tax Paid | Tax Assessment Tax Assessment Total Assessment is a certain percentage of the fair market value that is determined by local assessors to be the total taxable value of land and additions on the property. | Land | Improvement |
|---|---|---|---|---|
| 2025 | $4,077 | $400,674 | $162,000 | $238,674 |
| 2024 | $3,812 | $417,314 | $162,000 | $255,314 |
| 2023 | $3,693 | $407,374 | $160,650 | $246,724 |
| 2022 | $3,402 | $396,212 | $156,600 | $239,612 |
| 2021 | $3,150 | $339,997 | $135,000 | $204,997 |
| 2020 | $2,863 | $296,744 | $107,699 | $189,045 |
| 2019 | $2,615 | $279,444 | $95,090 | $184,354 |
| 2018 | $2,692 | $264,439 | $0 | $0 |
| 2017 | $2,285 | $225,984 | $0 | $0 |
| 2016 | $2,084 | $200,156 | $0 | $0 |
Source: Public Records
Map
Nearby Homes
Your Personal Tour Guide
Ask me questions while you tour the home.