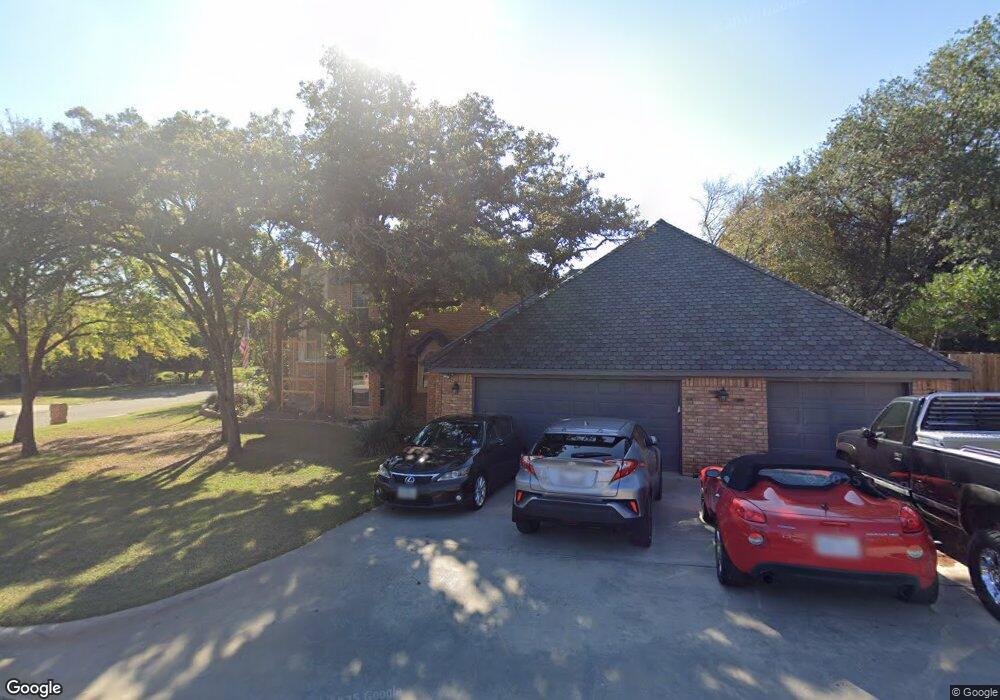
2313 Hollyhill Ln Denton, TX 76205
South Denton NeighborhoodEstimated Value: $593,000 - $703,000
4
Beds
5
Baths
4,023
Sq Ft
$163/Sq Ft
Est. Value
About This Home
This home is located at 2313 Hollyhill Ln, Denton, TX 76205 and is currently estimated at $657,282, approximately $163 per square foot. 2313 Hollyhill Ln is a home located in Denton County with nearby schools including Houston Elementary School, McMath Middle School, and Denton High School.
Ownership History
Date
Name
Owned For
Owner Type
Purchase Details
Closed on
Dec 14, 2015
Sold by
Barrus Teri Lynn and Barrus Teri L
Bought by
Ortega John Charles and Currier Caren Denise
Current Estimated Value
Home Financials for this Owner
Home Financials are based on the most recent Mortgage that was taken out on this home.
Original Mortgage
$288,000
Outstanding Balance
$227,835
Interest Rate
3.88%
Mortgage Type
New Conventional
Estimated Equity
$429,447
Purchase Details
Closed on
Apr 27, 2015
Sold by
Barrus Paul E
Bought by
Barrus Teri L
Purchase Details
Closed on
Jan 27, 1997
Sold by
Miller Lawrence B and Miller Sharyn B
Bought by
Barrus Paul E and Barrus Teri Lynn
Home Financials for this Owner
Home Financials are based on the most recent Mortgage that was taken out on this home.
Original Mortgage
$199,900
Interest Rate
7.64%
Create a Home Valuation Report for This Property
The Home Valuation Report is an in-depth analysis detailing your home's value as well as a comparison with similar homes in the area
Home Values in the Area
Average Home Value in this Area
Purchase History
| Date | Buyer | Sale Price | Title Company |
|---|---|---|---|
| Ortega John Charles | -- | Fatco | |
| Barrus Teri L | -- | None Available | |
| Barrus Paul E | -- | First American Title Ins |
Source: Public Records
Mortgage History
| Date | Status | Borrower | Loan Amount |
|---|---|---|---|
| Open | Ortega John Charles | $288,000 | |
| Previous Owner | Barrus Paul E | $199,900 |
Source: Public Records
Tax History Compared to Growth
Tax History
| Year | Tax Paid | Tax Assessment Tax Assessment Total Assessment is a certain percentage of the fair market value that is determined by local assessors to be the total taxable value of land and additions on the property. | Land | Improvement |
|---|---|---|---|---|
| 2025 | $8,451 | $518,461 | $172,450 | $346,011 |
| 2024 | $10,160 | $526,365 | $0 | $0 |
| 2023 | $7,940 | $478,514 | $163,797 | $355,203 |
| 2022 | $9,235 | $435,013 | $137,960 | $346,585 |
| 2021 | $8,791 | $395,466 | $81,914 | $313,552 |
| 2020 | $9,122 | $399,094 | $81,914 | $317,180 |
| 2019 | $9,302 | $389,867 | $81,914 | $307,953 |
| 2018 | $9,646 | $399,320 | $81,914 | $317,406 |
| 2017 | $9,870 | $399,308 | $81,914 | $319,086 |
| 2016 | $9,229 | $363,007 | $81,914 | $281,093 |
| 2015 | $9,917 | $428,990 | $65,531 | $363,459 |
| 2014 | $9,917 | $407,000 | $65,531 | $347,003 |
| 2013 | -- | $370,000 | $65,531 | $304,469 |
Source: Public Records
Map
Nearby Homes
- 2272 Hollyhill Ln
- 2544 Natchez Trace
- 2253 Hollyhill Ln
- 1412 Ridgecrest Cir
- 209 Pennsylvania Dr
- 2218 Southridge Dr
- 924 Ridgecrest Cir
- 2501 Great Bear Ln
- 2009 Lake Fork Ct
- 916 Smokerise Cir
- 720 Smokerise Cir
- 2312 Caddo Cir
- 1012 Indian Ridge Dr
- 2012 Hollyhill Ln
- 2000 Lamprey Cir
- 1000 Lynhurst Ln
- 2209 Loon Lake Rd
- 1108 Ellison Park Cir
- 2409 Loon Lake Rd
- 2505 Pioneer Dr
- 2309 Hollyhill Ln
- 2312 Stonegate Cir
- 2308 Stonegate Cir
- 2324 Hollyhill Ln
- 2316 Hollyhill Ln
- 2312 Hollyhill Ln
- 2320 Hollyhill Ln
- 2305 Hollyhill Ln
- 2400 Stonegate Cir
- 2304 Stonegate Cir
- 2308 Hollyhill Ln
- 2309 Stonegate Cir
- 2304 Hollyhill Ln
- 2401 Stonegate Cir
- 2305 Stonegate Cir
- 2301 Hollyhill Ln
- 2404 Stonegate Cir
- 2300 Stonegate Cir
- 2300 Hollyhill Ln
- 2442 Lillian Miller Pkwy