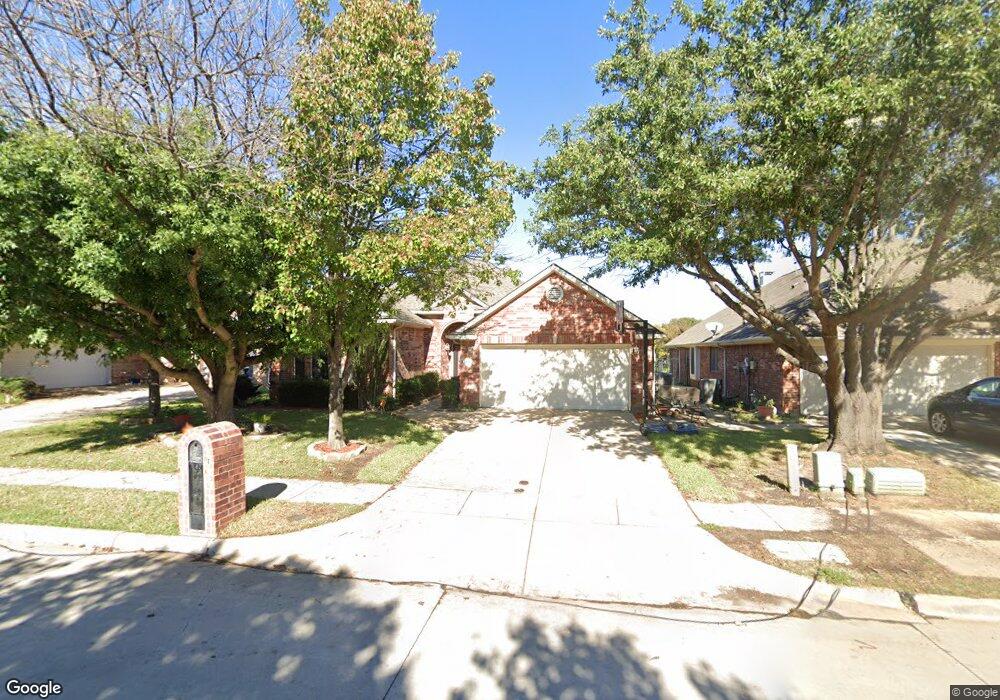
2313 Loon Lake Rd Denton, TX 76210
South Denton NeighborhoodEstimated Value: $392,795 - $420,000
4
Beds
2
Baths
2,292
Sq Ft
$177/Sq Ft
Est. Value
About This Home
This home is located at 2313 Loon Lake Rd, Denton, TX 76210 and is currently estimated at $404,949, approximately $176 per square foot. 2313 Loon Lake Rd is a home located in Denton County with nearby schools including Houston Elementary School, McMath Middle School, and Denton High School.
Ownership History
Date
Name
Owned For
Owner Type
Purchase Details
Closed on
Oct 31, 2016
Sold by
Thompson Tommy
Bought by
Thompson Todd A and Thompson Laura A
Current Estimated Value
Home Financials for this Owner
Home Financials are based on the most recent Mortgage that was taken out on this home.
Original Mortgage
$237,500
Outstanding Balance
$191,031
Interest Rate
3.48%
Mortgage Type
New Conventional
Estimated Equity
$213,918
Purchase Details
Closed on
Jul 20, 2001
Sold by
Lynch Daniel P
Bought by
Thompson Tommy
Home Financials for this Owner
Home Financials are based on the most recent Mortgage that was taken out on this home.
Original Mortgage
$152,460
Interest Rate
11.12%
Purchase Details
Closed on
Sep 23, 1999
Sold by
Paul Taylor Homes Ltd
Bought by
Lynch Daniel P
Home Financials for this Owner
Home Financials are based on the most recent Mortgage that was taken out on this home.
Original Mortgage
$124,125
Interest Rate
7.83%
Create a Home Valuation Report for This Property
The Home Valuation Report is an in-depth analysis detailing your home's value as well as a comparison with similar homes in the area
Home Values in the Area
Average Home Value in this Area
Purchase History
| Date | Buyer | Sale Price | Title Company |
|---|---|---|---|
| Thompson Todd A | -- | Chicago Title | |
| Thompson Tommy | -- | -- | |
| Lynch Daniel P | -- | -- |
Source: Public Records
Mortgage History
| Date | Status | Borrower | Loan Amount |
|---|---|---|---|
| Open | Thompson Todd A | $237,500 | |
| Previous Owner | Thompson Tommy | $152,460 | |
| Previous Owner | Lynch Daniel P | $124,125 | |
| Closed | Lynch Daniel P | $33,050 |
Source: Public Records
Tax History Compared to Growth
Tax History
| Year | Tax Paid | Tax Assessment Tax Assessment Total Assessment is a certain percentage of the fair market value that is determined by local assessors to be the total taxable value of land and additions on the property. | Land | Improvement |
|---|---|---|---|---|
| 2025 | $6,278 | $405,102 | $78,177 | $326,925 |
| 2024 | $7,473 | $387,171 | $78,177 | $308,994 |
| 2023 | $6,022 | $378,093 | $78,177 | $326,817 |
| 2022 | $7,297 | $343,721 | $78,177 | $265,544 |
| 2021 | $6,223 | $279,933 | $61,182 | $218,751 |
| 2020 | $6,027 | $263,667 | $61,182 | $202,485 |
| 2019 | $6,191 | $259,473 | $61,182 | $198,291 |
| 2018 | $6,015 | $249,019 | $61,182 | $187,837 |
| 2017 | $5,648 | $228,497 | $61,182 | $167,315 |
| 2016 | $5,520 | $209,150 | $40,788 | $173,603 |
| 2015 | $4,254 | $190,136 | $40,788 | $149,348 |
| 2013 | -- | $171,072 | $40,788 | $130,284 |
Source: Public Records
Map
Nearby Homes
- 2409 Loon Lake Rd
- 2209 Loon Lake Rd
- 2312 Caddo Cir
- 2505 Pioneer Dr
- 2508 Pioneer Dr
- 2600 Pioneer Dr
- 3432 Sundown Blvd
- 2000 Lamprey Cir
- 2009 Lake Fork Ct
- 2601 Pinto Dr
- 2501 Great Bear Ln
- 2713 Clubhouse Dr
- 2617 Hereford Rd
- 2721 Arabian Ave
- 2544 Natchez Trace
- 2617 Hollow Ridge Dr
- 720 Smokerise Cir
- 1108 Ellison Park Cir
- 2817 Hereford Rd
- 3428 Tuscan Hills Cir
- 2317 Loon Lake Rd
- 2309 Loon Lake Rd
- 2305 Loon Lake Rd
- 2321 Loon Lake Rd
- 2312 Loon Lake Rd
- 2308 Loon Lake Rd
- 2301 Loon Lake Rd
- 2316 Loon Lake Rd
- 2304 Loon Lake Rd
- 2320 Loon Lake Rd
- 2300 Loon Lake Rd
- 2405 Loon Lake Rd
- 2221 Loon Lake Rd
- 2400 Loon Lake Rd
- 2324 Champlain Ln
- 2400 Champlain Ln
- 2220 Loon Lake Rd
- 2305 Palamino Ct
- 2309 Palamino Ct
- 2217 Loon Lake Rd