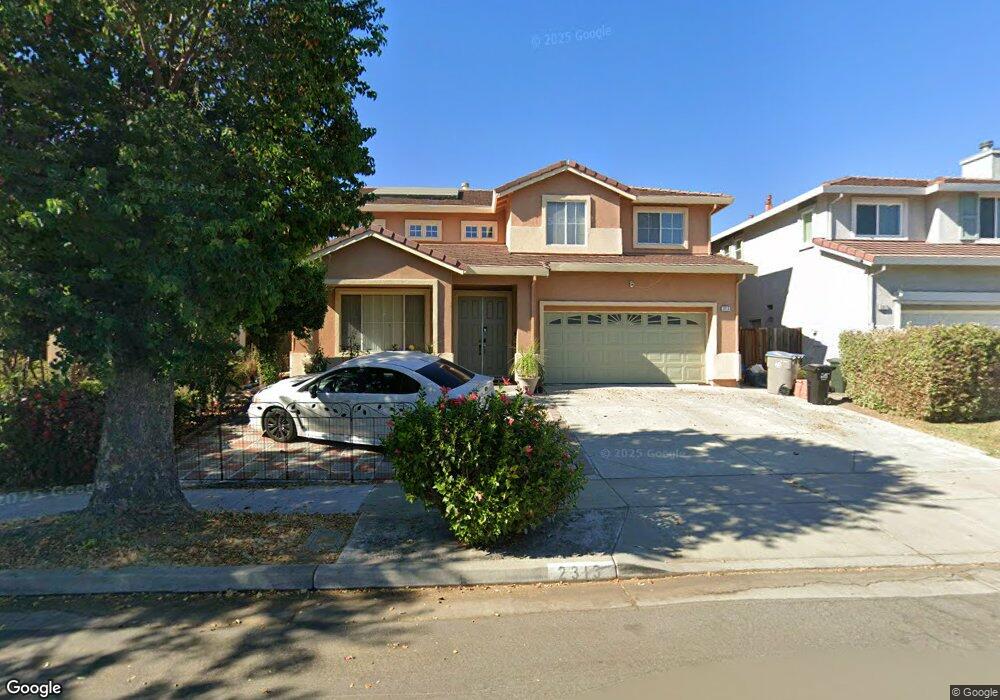
2313 Old Post Way San Jose, CA 95132
Old Port NeighborhoodEstimated Value: $1,720,000 - $2,059,000
5
Beds
3
Baths
2,410
Sq Ft
$766/Sq Ft
Est. Value
About This Home
This home is located at 2313 Old Post Way, San Jose, CA 95132 and is currently estimated at $1,845,917, approximately $765 per square foot. 2313 Old Post Way is a home located in Santa Clara County with nearby schools including Cherrywood Elementary School, Sierramont Middle School, and Independence High School.
Ownership History
Date
Name
Owned For
Owner Type
Purchase Details
Closed on
Nov 21, 2022
Sold by
Vu Ut Thi
Bought by
Ut Thi Vu Trust and Vu
Current Estimated Value
Purchase Details
Closed on
Aug 23, 2019
Sold by
Vu Lieu D
Bought by
Vu Ut Thi and Vu Lieu D
Home Financials for this Owner
Home Financials are based on the most recent Mortgage that was taken out on this home.
Original Mortgage
$470,000
Interest Rate
3.8%
Mortgage Type
New Conventional
Purchase Details
Closed on
May 16, 2003
Sold by
Vu Lieu D and Vu Ut Thi
Bought by
Vu Lieu D
Home Financials for this Owner
Home Financials are based on the most recent Mortgage that was taken out on this home.
Original Mortgage
$420,000
Interest Rate
5.77%
Mortgage Type
Stand Alone First
Purchase Details
Closed on
Mar 10, 1997
Sold by
Braddock & Logan Group Lp
Bought by
Vu Lieu D and Vu Ut Thi
Home Financials for this Owner
Home Financials are based on the most recent Mortgage that was taken out on this home.
Original Mortgage
$274,300
Interest Rate
7.9%
Create a Home Valuation Report for This Property
The Home Valuation Report is an in-depth analysis detailing your home's value as well as a comparison with similar homes in the area
Home Values in the Area
Average Home Value in this Area
Purchase History
| Date | Buyer | Sale Price | Title Company |
|---|---|---|---|
| Ut Thi Vu Trust | -- | None Listed On Document | |
| Vu Ut Thi | -- | Orange Coast Ttl Co Of Nocal | |
| Vu Lieu D | -- | Chicago Title | |
| Vu Lieu D | $343,000 | First American Title Co |
Source: Public Records
Mortgage History
| Date | Status | Borrower | Loan Amount |
|---|---|---|---|
| Previous Owner | Vu Ut Thi | $470,000 | |
| Previous Owner | Vu Lieu D | $420,000 | |
| Previous Owner | Vu Lieu D | $274,300 |
Source: Public Records
Tax History Compared to Growth
Tax History
| Year | Tax Paid | Tax Assessment Tax Assessment Total Assessment is a certain percentage of the fair market value that is determined by local assessors to be the total taxable value of land and additions on the property. | Land | Improvement |
|---|---|---|---|---|
| 2025 | $8,461 | $558,453 | $228,005 | $330,448 |
| 2024 | $8,461 | $547,504 | $223,535 | $323,969 |
| 2023 | $8,297 | $536,769 | $219,152 | $317,617 |
| 2022 | $8,171 | $526,245 | $214,855 | $311,390 |
| 2021 | $7,894 | $515,928 | $210,643 | $305,285 |
| 2020 | $7,640 | $510,639 | $208,484 | $302,155 |
| 2019 | $7,347 | $500,628 | $204,397 | $296,231 |
| 2018 | $7,237 | $490,813 | $200,390 | $290,423 |
| 2017 | $7,270 | $481,190 | $196,461 | $284,729 |
| 2016 | $6,966 | $471,756 | $192,609 | $279,147 |
| 2015 | $6,881 | $464,670 | $189,716 | $274,954 |
| 2014 | $6,244 | $455,569 | $186,000 | $269,569 |
Source: Public Records
Map
Nearby Homes
- 2210 Renfrew Ct
- 2129 Doxey Dr
- 1332 Cabrillo Ave
- 2520 Amaryl Dr
- 2790 Longford Dr
- 2280 Zoria Cir
- 2064 Wizard Ct
- 1599 Clampett Way
- 1997 Lowney Way
- 1968 Nutmeg Ct
- 1464 Lucena Ct
- 1199 Morrill Ave
- 1260 Sierra Village Place
- 2616 Sierra Village Ct
- 1263 Flickinger Ave
- 1373 Ferrel Ct
- 1693 Peachwood Dr
- 1690 Coraltree Place
- 1062 Rymar Place
- 2861 Lausanne Ct
- 2317 Old Post Way
- 2309 Old Post Way
- 2668 Brookhollow Dr
- 2321 Old Post Way
- 2305 Old Post Way
- 2664 Brookhollow Dr
- 2672 Brookhollow Dr
- 2660 Brookhollow Dr
- 1363 Old Park Place
- 2676 Brookhollow Dr
- 2322 Old Post Way
- 2325 Old Post Way
- 1339 Old Stone Way
- 1343 Old Stone Way
- 2316 Old Post Way
- 2656 Brookhollow Dr
- 2680 Brookhollow Dr
- 1357 Old Park Place
- 2329 Old Post Way
- 2682 Brookhollow Dr