
Seller's Agent in 2025
Megan Sandoval
Intero Real Estate Services
(925) 354-2110
1 in this area
9 Total Sales

Estimated Value: $149,000 - $162,230
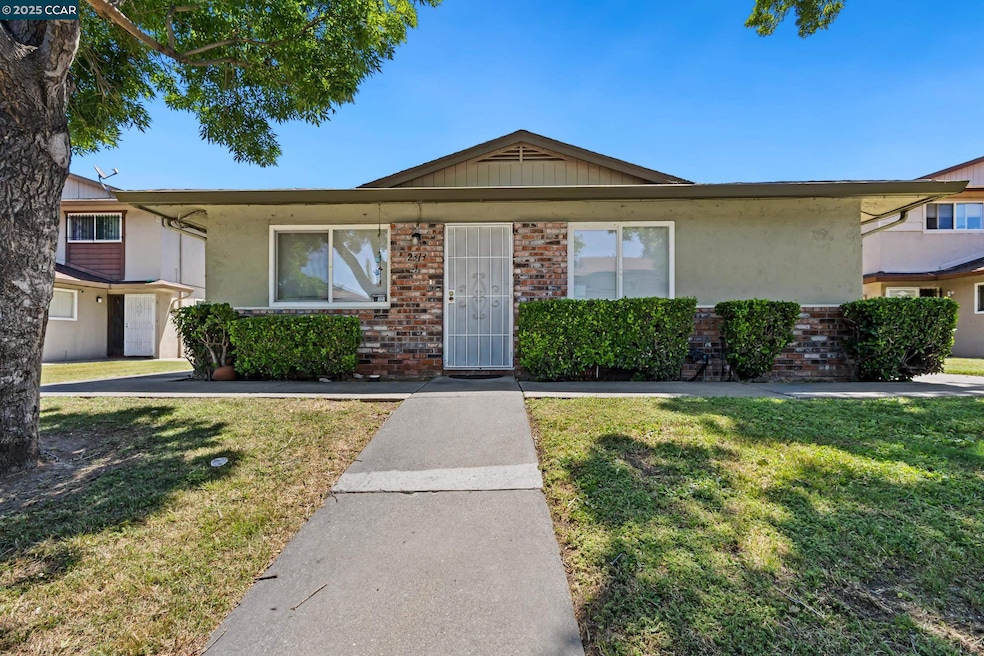
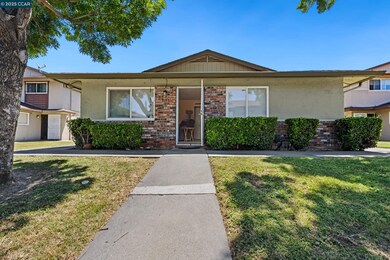
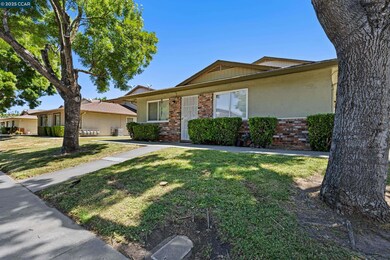
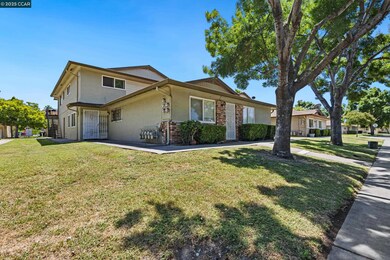
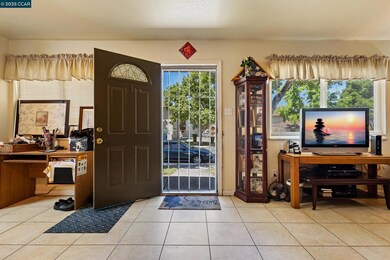
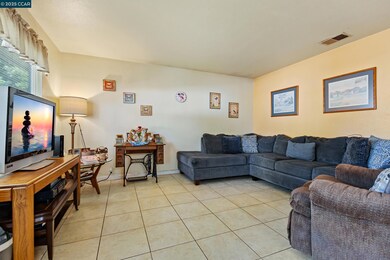
Welcome to 2313 Peppertree Way! Street level, no steps to entry. Open concept kitchen to living area. 2 bedrooms and 1 full bath. Central heat and A/C. Contra Loma Estates HOA includes landscape, water, garbage, pool and community center. Shared garage with additional locked storage space. Easy access to Hwy 4, schools, County Fairground and Century Plaza Shopping center. Great price for East Bay area living!
Last Agent to Sell the Property
Intero Real Estate Services License #01976540 Listed on: 05/20/2025
| Date | Buyer | Sale Price | Title Company |
|---|---|---|---|
| Feliciano Agustin | $150,000 | First American Title Insurance | |
| Vance Dana Michelle | -- | None Available | |
| Vance Dan A | -- | None Available | |
| Vance Dan A | $187,000 | Fidelity National Title | |
| Benton Michael T | $105,000 | Fidelity National Title Co | |
| Martinez Kim | -- | Fidelity National Title Co | |
| Martinez Kim | -- | -- | |
| Shaw Sharon E | $85,000 | Old Republic Title Company |
| Date | Status | Borrower | Loan Amount |
|---|---|---|---|
| Previous Owner | Shaw Sharon E | $51,000 |
| Date | Event | Price | List to Sale | Price per Sq Ft |
|---|---|---|---|---|
| 07/01/2025 07/01/25 | Sold | $150,000 | -6.3% | $182 / Sq Ft |
| 06/02/2025 06/02/25 | Pending | -- | -- | -- |
| 05/20/2025 05/20/25 | For Sale | $160,000 | -- | $195 / Sq Ft |
| Year | Tax Paid | Tax Assessment Tax Assessment Total Assessment is a certain percentage of the fair market value that is determined by local assessors to be the total taxable value of land and additions on the property. | Land | Improvement |
|---|---|---|---|---|
| 2025 | $2,432 | $180,710 | $69,160 | $111,550 |
| 2024 | $2,432 | $177,167 | $67,804 | $109,363 |
| 2023 | $2,362 | $173,694 | $66,475 | $107,219 |
| 2022 | $2,328 | $170,289 | $65,172 | $105,117 |
| 2021 | $2,235 | $166,951 | $63,895 | $103,056 |
| 2019 | $2,268 | $162,000 | $76,236 | $85,764 |
| 2018 | $2,090 | $150,000 | $70,589 | $79,411 |
| 2017 | $1,512 | $100,000 | $47,060 | $52,940 |
| 2016 | $1,145 | $69,500 | $32,707 | $36,793 |
| 2015 | $1,010 | $58,500 | $27,529 | $30,971 |
| 2014 | $914 | $52,000 | $24,471 | $27,529 |
Seller's Agent in 2025
Megan Sandoval
Intero Real Estate Services
(925) 354-2110
1 in this area
9 Total Sales
Buyer's Agent in 2025
Elizabeth Horat
Lozoya Real Estate
(925) 435-7024
5 in this area
64 Total Sales
Source: Contra Costa Association of REALTORS®
MLS Number: 41098272
APN: 074-351-027-3
Disclaimer: Certain information contained herein is derived from information provided by parties other than Homes.com. All information provided is deemed reliable, but is not guaranteed to be accurate and should be independently verified.
![]() Bay East ©2025. BridgeMLS ©2025, CCAR ©2025. Information Deemed Reliable But Not Guaranteed. This information is being provided by the Bay East MLS, BridgeMLS or CCAR MLS. The listings presented here may or may not be listed by the Broker/Agent operating this website. This information is intended for the personal use of consumers, and may not be used for any purpose other than to identify prospective properties consumers may be interested in purchasing.
Bay East ©2025. BridgeMLS ©2025, CCAR ©2025. Information Deemed Reliable But Not Guaranteed. This information is being provided by the Bay East MLS, BridgeMLS or CCAR MLS. The listings presented here may or may not be listed by the Broker/Agent operating this website. This information is intended for the personal use of consumers, and may not be used for any purpose other than to identify prospective properties consumers may be interested in purchasing.