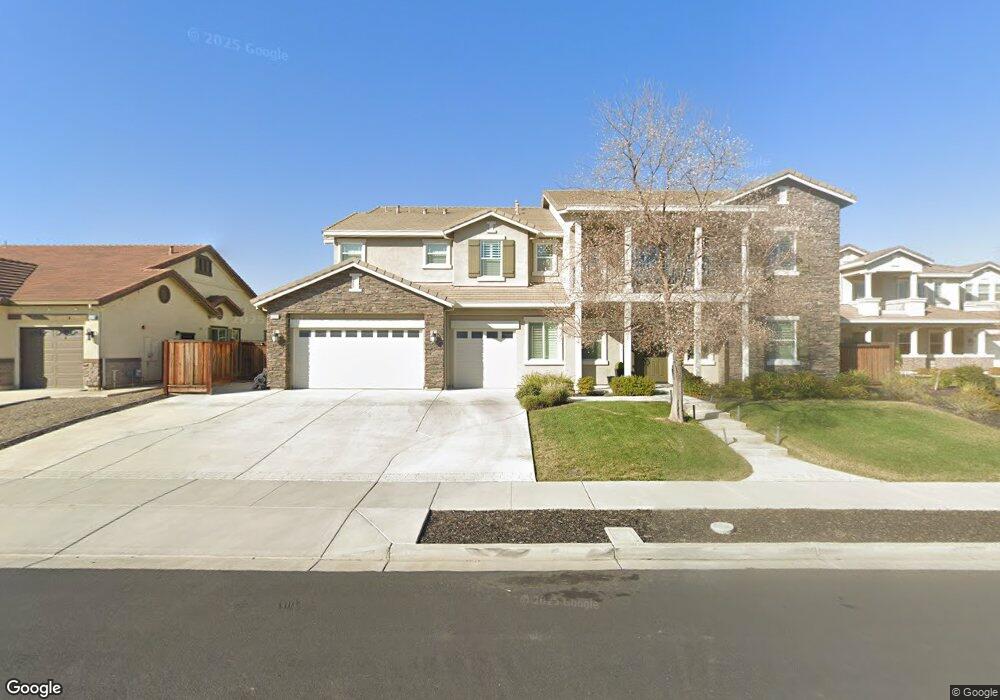
2313 Rutland Ct Brentwood, CA 94513
Prewett Ranch NeighborhoodEstimated Value: $1,497,000 - $1,647,000
5
Beds
4
Baths
4,910
Sq Ft
$318/Sq Ft
Est. Value
About This Home
This home is located at 2313 Rutland Ct, Brentwood, CA 94513 and is currently estimated at $1,561,476, approximately $318 per square foot. 2313 Rutland Ct is a home located in Contra Costa County with nearby schools including Marsh Creek Elementary School, William B. Bristow Middle School, and Liberty High School.
Ownership History
Date
Name
Owned For
Owner Type
Purchase Details
Closed on
Jun 20, 2023
Sold by
Wasem Brian T and Wasem Amber L
Bought by
Gamez Jorelle Frank Yamsua and Gamez Maria Cristina
Current Estimated Value
Home Financials for this Owner
Home Financials are based on the most recent Mortgage that was taken out on this home.
Original Mortgage
$1,200,000
Outstanding Balance
$1,167,677
Interest Rate
6.35%
Mortgage Type
New Conventional
Estimated Equity
$393,799
Purchase Details
Closed on
Apr 22, 2016
Sold by
Discover Builders Inc
Bought by
Wasem Briant and Wasem Amber L
Home Financials for this Owner
Home Financials are based on the most recent Mortgage that was taken out on this home.
Original Mortgage
$625,500
Interest Rate
3.68%
Mortgage Type
New Conventional
Create a Home Valuation Report for This Property
The Home Valuation Report is an in-depth analysis detailing your home's value as well as a comparison with similar homes in the area
Home Values in the Area
Average Home Value in this Area
Purchase History
| Date | Buyer | Sale Price | Title Company |
|---|---|---|---|
| Gamez Jorelle Frank Yamsua | $1,500,000 | Orange Coast Title Company | |
| Wasem Briant | $810,000 | Old Republic Title Company |
Source: Public Records
Mortgage History
| Date | Status | Borrower | Loan Amount |
|---|---|---|---|
| Open | Gamez Jorelle Frank Yamsua | $1,200,000 | |
| Previous Owner | Wasem Briant | $625,500 |
Source: Public Records
Tax History Compared to Growth
Tax History
| Year | Tax Paid | Tax Assessment Tax Assessment Total Assessment is a certain percentage of the fair market value that is determined by local assessors to be the total taxable value of land and additions on the property. | Land | Improvement |
|---|---|---|---|---|
| 2025 | $19,117 | $1,560,600 | $312,120 | $1,248,480 |
| 2024 | $12,859 | $1,530,000 | $306,000 | $1,224,000 |
| 2023 | $12,859 | $981,331 | $170,672 | $810,659 |
| 2022 | $12,607 | $962,090 | $167,326 | $794,764 |
| 2021 | $12,272 | $943,227 | $164,046 | $779,181 |
| 2019 | $12,460 | $915,252 | $159,181 | $756,071 |
| 2018 | $12,045 | $897,307 | $156,060 | $741,247 |
| 2017 | $11,151 | $825,792 | $153,000 | $672,792 |
| 2016 | $2,976 | $130,000 | $130,000 | $0 |
| 2015 | $2,368 | $120,000 | $120,000 | $0 |
| 2014 | $1,475 | $35,000 | $35,000 | $0 |
Source: Public Records
Map
Nearby Homes
- 2255 Sugarloaf Ct
- 1949 Crowley Ct
- Plan 4 at Orchard Grove
- Plan 1 at Orchard Grove
- Plan 2 at Orchard Grove
- Plan 3 at Orchard Grove
- 2029 Fitzgerald Way
- 445 Trellis
- 476 Trellis Way
- 434 Trellis Way
- 475 Trellis Way
- 494 Trellis Way
- 464 Trellis Way
- 428 Trellis Way
- 457 Trellis Way
- 2571 Anderson Ln
- 1004 Royal Tern Ct
- 170 Sunrise Dr
- 1097 Teal Ct
- 1101 Beau Ave
- 2313 Rutland Ct
- 2317 Rutland Ct
- 2317 Rutland Ct
- 2309 Ruthland Ct
- 2309 Rutland Ct
- 2336 Atterbury Ln
- 2332 Atterbury Ln
- 2340 Atterbury Ln
- 2321 Rutland Ct
- 2305 Rutland Ct
- 2305 Rutland Ct
- 2332 Atterbury Ln
- 2340 Atterbury Ln
- 2321 Rutland Ct
- 2312 Rutland Ct
- 2316 Rutland Ct
- 2308 Rutland Ct
- 2344 Atterbury Ln
- 2320 Rutland Ct
- 2304 Ruthland Ct