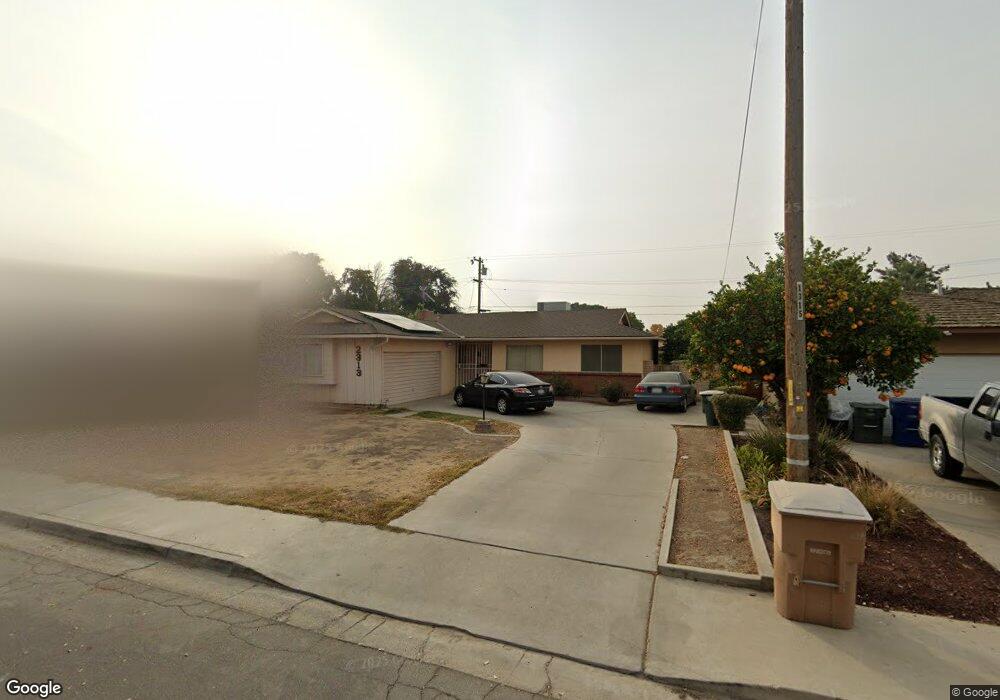
2313 Woolard Dr Bakersfield, CA 93304
Wible Orchard NeighborhoodEstimated Value: $280,000 - $311,000
3
Beds
2
Baths
1,192
Sq Ft
$248/Sq Ft
Est. Value
About This Home
This home is located at 2313 Woolard Dr, Bakersfield, CA 93304 and is currently estimated at $295,598, approximately $247 per square foot. 2313 Woolard Dr is a home located in Kern County with nearby schools including Planz Elementary School, Greenfield Middle School, and South High School.
Ownership History
Date
Name
Owned For
Owner Type
Purchase Details
Closed on
Jul 7, 2014
Sold by
Purdie Kathleen A and Purdie Kathleen Ann
Bought by
Purdie Kathleen A
Current Estimated Value
Home Financials for this Owner
Home Financials are based on the most recent Mortgage that was taken out on this home.
Original Mortgage
$91,000
Outstanding Balance
$69,080
Interest Rate
4.07%
Mortgage Type
New Conventional
Estimated Equity
$226,518
Purchase Details
Closed on
Apr 13, 2011
Sold by
Comaianni Martin F and Comaianni Sheri L
Bought by
Purdie Kathleen Ann
Home Financials for this Owner
Home Financials are based on the most recent Mortgage that was taken out on this home.
Original Mortgage
$77,972
Interest Rate
5.25%
Mortgage Type
FHA
Purchase Details
Closed on
Jan 11, 2011
Sold by
Comaianni Martin
Bought by
Comaianni Martin F and Comaianni Sheri L
Create a Home Valuation Report for This Property
The Home Valuation Report is an in-depth analysis detailing your home's value as well as a comparison with similar homes in the area
Home Values in the Area
Average Home Value in this Area
Purchase History
| Date | Buyer | Sale Price | Title Company |
|---|---|---|---|
| Purdie Kathleen A | -- | Placer Title Company | |
| Purdie Kathleen Ann | $80,000 | First American Title Company | |
| Comaianni Martin F | -- | None Available | |
| Comaianni Martin | -- | None Available |
Source: Public Records
Mortgage History
| Date | Status | Borrower | Loan Amount |
|---|---|---|---|
| Open | Purdie Kathleen A | $91,000 | |
| Closed | Purdie Kathleen Ann | $77,972 |
Source: Public Records
Tax History
| Year | Tax Paid | Tax Assessment Tax Assessment Total Assessment is a certain percentage of the fair market value that is determined by local assessors to be the total taxable value of land and additions on the property. | Land | Improvement |
|---|---|---|---|---|
| 2025 | $1,832 | $102,482 | $25,617 | $76,865 |
| 2024 | $1,787 | $100,473 | $25,115 | $75,358 |
| 2023 | $1,787 | $98,504 | $24,623 | $73,881 |
| 2022 | $1,751 | $96,574 | $24,141 | $72,433 |
| 2021 | $1,640 | $94,681 | $23,668 | $71,013 |
| 2020 | $1,590 | $93,711 | $23,426 | $70,285 |
| 2019 | $1,563 | $93,711 | $23,426 | $70,285 |
| 2018 | $1,500 | $90,073 | $22,517 | $67,556 |
| 2017 | $1,484 | $88,308 | $22,076 | $66,232 |
| 2016 | $1,404 | $86,578 | $21,644 | $64,934 |
| 2015 | $1,381 | $85,278 | $21,319 | $63,959 |
| 2014 | $1,355 | $83,609 | $20,902 | $62,707 |
Source: Public Records
Map
Nearby Homes
- 2320 Belvedere Ave
- 2404 Belvedere Ave
- 3100 Leonard St
- 2510 Wilson Rd
- 3205 Durrwood St
- 2701 Houchin Rd
- 1916 Wilson Rd
- 2512 Blackstone Ct
- 2909 Gemline Ave
- 2725 Agate St
- 2200 Julian Ave
- 443 Myrtle St
- 2712 Morin Ct
- 2912 Wilson Rd
- 3508 El Alisal St
- 1804 Le May Ave
- 3501 Argent St
- 1920 Doolittle Ave
- 3517 McCourry St
- 3007 Doris Ln
- 2309 Woolard Dr
- 2317 Woolard Dr
- 2312 Oakwood Dr
- 2308 Oakwood Dr
- 2316 Oakwood Dr
- 2305 Woolard Dr
- 2401 Woolard Dr
- 2420 Oakwood Dr
- 2304 Oakwood Dr
- 2312 Woolard Dr
- 2400 Oakwood Dr
- 2412 Oakwood Dr
- 2308 Woolard Dr
- 2316 Woolard Dr
- 2301 Woolard Dr
- 2405 Woolard Dr
- 2400 Woolard Dr
- 2404 Oakwood Dr
- 2300 Oakwood Dr
- 2404 Woolard Dr
Your Personal Tour Guide
Ask me questions while you tour the home.