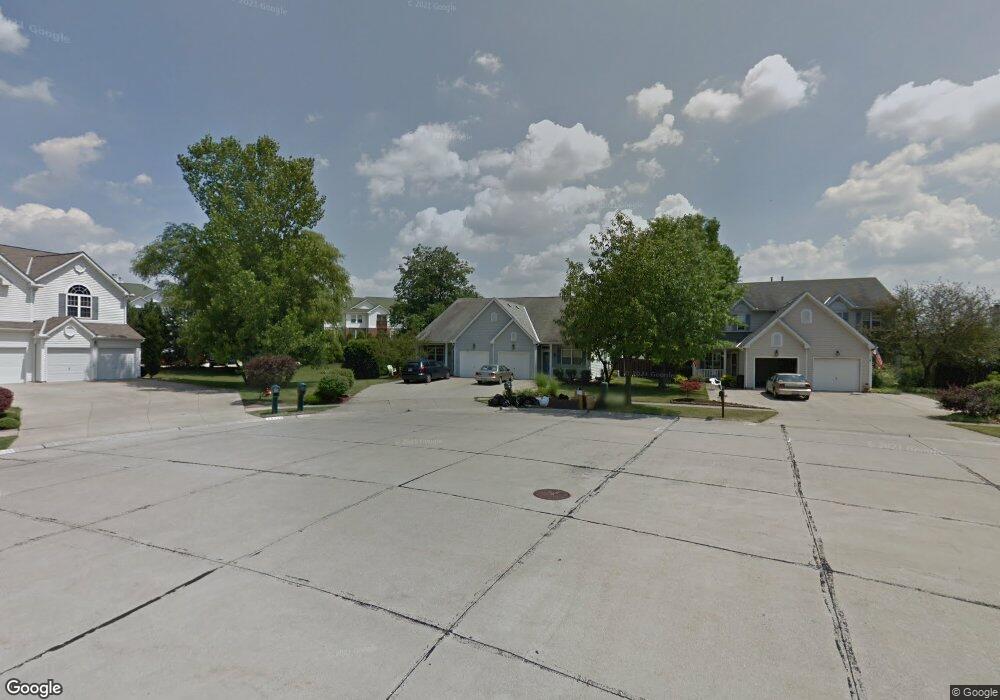
23135 Wainwright Terrace Olmsted Falls, OH 44138
Estimated Value: $234,555 - $267,000
2
Beds
3
Baths
1,350
Sq Ft
$186/Sq Ft
Est. Value
About This Home
This home is located at 23135 Wainwright Terrace, Olmsted Falls, OH 44138 and is currently estimated at $251,639, approximately $186 per square foot. 23135 Wainwright Terrace is a home located in Cuyahoga County with nearby schools including Falls-Lenox Primary Elementary School, Olmsted Falls Intermediate Building, and Olmsted Falls Middle School.
Ownership History
Date
Name
Owned For
Owner Type
Purchase Details
Closed on
Apr 22, 2005
Sold by
Petz Craig A and Petz Karen D
Bought by
Shepard April M
Current Estimated Value
Home Financials for this Owner
Home Financials are based on the most recent Mortgage that was taken out on this home.
Original Mortgage
$117,700
Outstanding Balance
$61,171
Interest Rate
5.89%
Mortgage Type
Purchase Money Mortgage
Estimated Equity
$190,468
Purchase Details
Closed on
Dec 22, 1997
Sold by
Towers Douglas W
Bought by
Petz Craig A
Home Financials for this Owner
Home Financials are based on the most recent Mortgage that was taken out on this home.
Original Mortgage
$119,700
Interest Rate
7.13%
Mortgage Type
New Conventional
Purchase Details
Closed on
Dec 30, 1992
Sold by
Towers Douglas W
Bought by
Towers Douglas W
Purchase Details
Closed on
Jun 9, 1992
Sold by
Shorewest Const
Bought by
Towers Douglas W
Purchase Details
Closed on
Jan 1, 1991
Bought by
Shorewest Const
Create a Home Valuation Report for This Property
The Home Valuation Report is an in-depth analysis detailing your home's value as well as a comparison with similar homes in the area
Home Values in the Area
Average Home Value in this Area
Purchase History
| Date | Buyer | Sale Price | Title Company |
|---|---|---|---|
| Shepard April M | $147,500 | Real Living Title Agency L | |
| Petz Craig A | $126,000 | -- | |
| Towers Douglas W | -- | -- | |
| Towers Douglas W | $119,100 | -- | |
| Shorewest Const | -- | -- |
Source: Public Records
Mortgage History
| Date | Status | Borrower | Loan Amount |
|---|---|---|---|
| Open | Shepard April M | $117,700 | |
| Previous Owner | Petz Craig A | $119,700 | |
| Closed | Shepard April M | $29,800 |
Source: Public Records
Tax History Compared to Growth
Tax History
| Year | Tax Paid | Tax Assessment Tax Assessment Total Assessment is a certain percentage of the fair market value that is determined by local assessors to be the total taxable value of land and additions on the property. | Land | Improvement |
|---|---|---|---|---|
| 2024 | $4,639 | $68,845 | $12,705 | $56,140 |
| 2023 | $4,711 | $57,580 | $12,290 | $45,290 |
| 2022 | $4,673 | $57,580 | $12,290 | $45,290 |
| 2021 | $5,661 | $57,580 | $12,290 | $45,290 |
| 2020 | $4,685 | $51,870 | $11,060 | $40,810 |
| 2019 | $4,172 | $148,200 | $31,600 | $116,600 |
| 2018 | $4,338 | $51,870 | $11,060 | $40,810 |
| 2017 | $3,611 | $41,200 | $8,790 | $32,410 |
| 2016 | $4,200 | $41,200 | $8,790 | $32,410 |
| 2015 | $3,657 | $41,200 | $8,790 | $32,410 |
| 2014 | $3,657 | $38,860 | $8,300 | $30,560 |
Source: Public Records
Map
Nearby Homes
- 23155 Wainwright Terrace
- 23002 Chandlers Ln
- 23002 Chandlers Ln Unit 342
- 23002 Chandlers Ln Unit 221
- 23003 Chandlers Ln Unit 219
- 23003 Chandlers Ln Unit 230
- 9797 Sugarbush Cir
- 23390 Wainwright Terrace
- 647 Tampico Ct Unit 7
- 23514 Grist Mill Ct Unit 4
- 458 Sprague Rd
- 537 Wyleswood Dr
- 543 Wyleswood Dr
- 549 Wyleswood Dr
- 412 Wyleswood Dr
- 344 Girard Dr
- V/L Aldridge Dr
- 8809 Leatherleaf Dr
- 396 Crossbrook Dr
- 255 Fairpark Dr
- 23145 Wainwright Terrace
- 23100 Wainwright Terrace
- 23165 Wainwright Terrace
- 23110 Wainwright Terrace
- 23175 Wainwright Terrace
- 23120 Wainwright Terrace
- 23185 Wainwright Terrace
- 23130 Wainwright Terrace
- 23002 Chandlers Ln Unit B106
- 23002 Chandlers Ln Unit 338
- 23002 Chandlers Ln Unit 344
- 23002 Chandlers Ln Unit 217
- 23002 Chandlers Ln Unit 104
- 23002 Chandlers Ln Unit 105
- 23002 Chandlers Ln Unit 219
- 23002 Chandlers Ln Unit 340
- 23002 Chandlers Ln Unit 343
- 23002 Chandlers Ln Unit 111
- 23002 Chandlers Ln Unit 115
- 23002 Chandlers Ln Unit 341