Estimated Value: $187,000 - $244,000
2
Beds
1
Bath
888
Sq Ft
$242/Sq Ft
Est. Value
About This Home
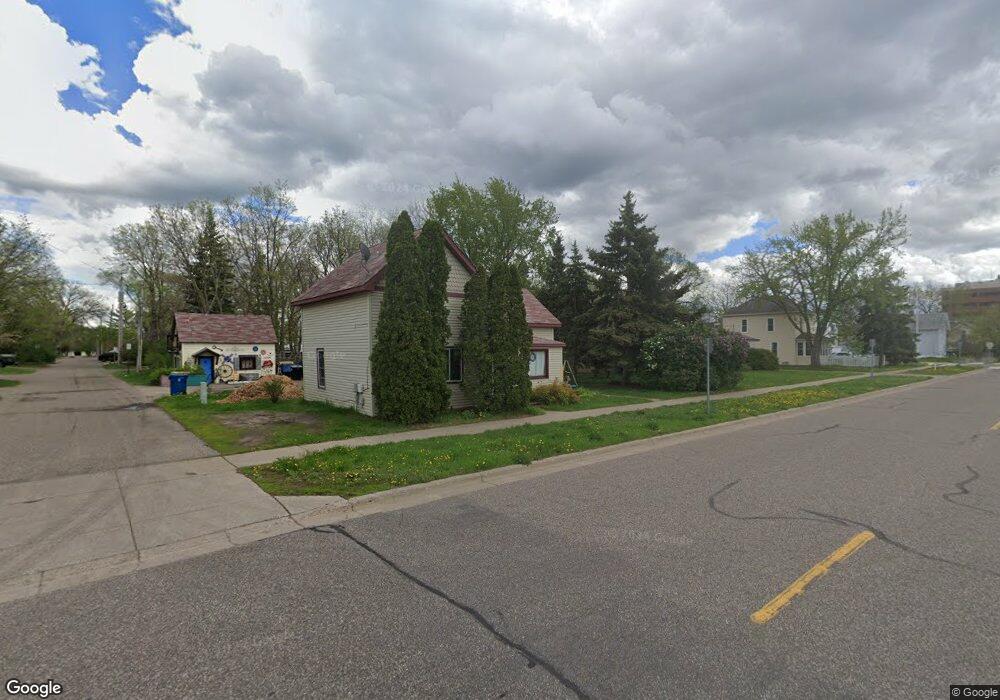
This home is located at 2314 3rd Ave, Anoka, MN 55303 and is currently estimated at $214,526, approximately $241 per square foot. 2314 3rd Ave is a home located in Anoka County with nearby schools including Lincoln Elementary School for the Arts, Anoka Middle School for the Arts - Fred Moor Campus, and Anoka Senior High School.
Ownership History
Date
Name
Owned For
Owner Type
Purchase Details
Closed on
Feb 28, 2017
Sold by
Tcf National Bank
Bought by
Wolf Donna M
Current Estimated Value
Home Financials for this Owner
Home Financials are based on the most recent Mortgage that was taken out on this home.
Original Mortgage
$94,811
Outstanding Balance
$78,666
Interest Rate
4.19%
Mortgage Type
New Conventional
Estimated Equity
$135,860
Purchase Details
Closed on
Jun 20, 2016
Sold by
Andrews Helen M
Bought by
Tcf National Bank
Purchase Details
Closed on
Aug 26, 1996
Sold by
Marten James R and Marten Bonita
Bought by
Andrews Helen M
Create a Home Valuation Report for This Property
The Home Valuation Report is an in-depth analysis detailing your home's value as well as a comparison with similar homes in the area
Home Values in the Area
Average Home Value in this Area
Purchase History
| Date | Buyer | Sale Price | Title Company |
|---|---|---|---|
| Wolf Donna M | $100,778 | Burnet Title | |
| Tcf National Bank | $105,033 | Attorney | |
| Andrews Helen M | $20,614 | -- |
Source: Public Records
Mortgage History
| Date | Status | Borrower | Loan Amount |
|---|---|---|---|
| Open | Wolf Donna M | $94,811 |
Source: Public Records
Tax History Compared to Growth
Tax History
| Year | Tax Paid | Tax Assessment Tax Assessment Total Assessment is a certain percentage of the fair market value that is determined by local assessors to be the total taxable value of land and additions on the property. | Land | Improvement |
|---|---|---|---|---|
| 2025 | $1,756 | $186,500 | $70,000 | $116,500 |
| 2024 | $1,756 | $183,400 | $65,000 | $118,400 |
| 2023 | $1,601 | $189,700 | $65,000 | $124,700 |
| 2022 | $1,495 | $184,400 | $52,500 | $131,900 |
| 2021 | $1,520 | $155,800 | $47,300 | $108,500 |
| 2020 | $1,489 | $154,500 | $52,500 | $102,000 |
| 2019 | $1,416 | $146,600 | $45,000 | $101,600 |
| 2018 | $1,300 | $137,400 | $0 | $0 |
| 2017 | $1,740 | $124,500 | $0 | $0 |
| 2016 | $1,103 | $106,500 | $0 | $0 |
| 2015 | $982 | $106,500 | $35,000 | $71,500 |
| 2014 | -- | $81,800 | $19,500 | $62,300 |
Source: Public Records
Map
Nearby Homes