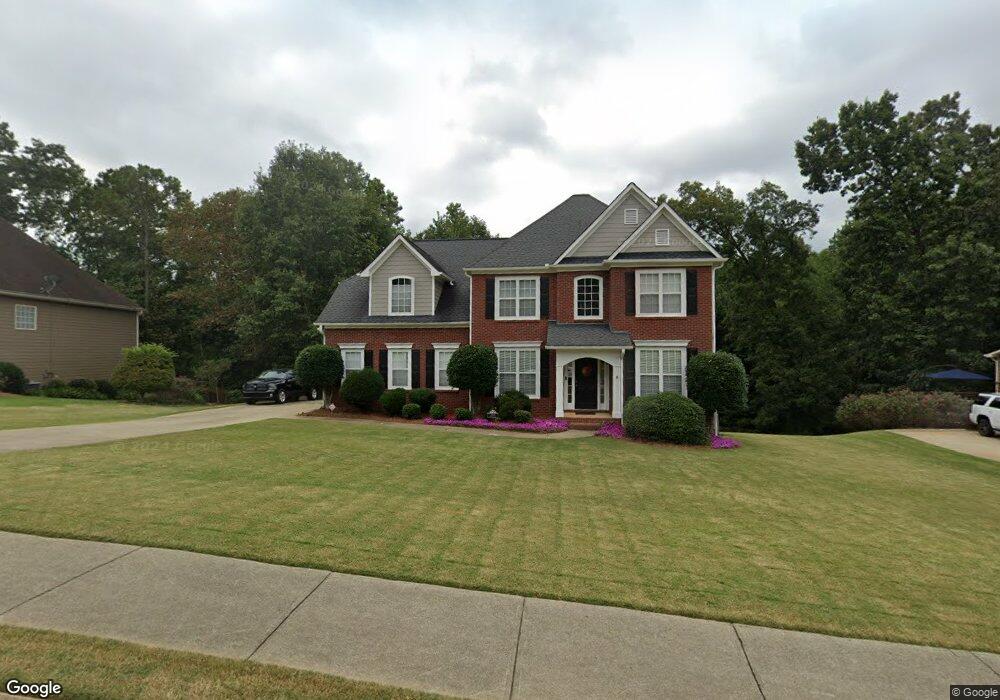
2314 Oak Falls Ln Buford, GA 30519
Estimated Value: $484,000 - $545,000
4
Beds
3
Baths
2,655
Sq Ft
$190/Sq Ft
Est. Value
About This Home
This home is located at 2314 Oak Falls Ln, Buford, GA 30519 and is currently estimated at $504,839, approximately $190 per square foot. 2314 Oak Falls Ln is a home located in Gwinnett County with nearby schools including Duncan Creek Elementary School, Frank N. Osborne Middle School, and Mill Creek High School.
Ownership History
Date
Name
Owned For
Owner Type
Purchase Details
Closed on
Jul 5, 2023
Sold by
Pollock Paul
Bought by
Poloock Paul Eugene and Pollock Carole Ann
Current Estimated Value
Purchase Details
Closed on
Jun 25, 2004
Sold by
Sirva Relocation Llc
Bought by
Pollock Paul and Pollock Carole
Home Financials for this Owner
Home Financials are based on the most recent Mortgage that was taken out on this home.
Original Mortgage
$20,000
Interest Rate
6.25%
Mortgage Type
New Conventional
Purchase Details
Closed on
Nov 8, 2002
Sold by
Northstar Hms Llc
Bought by
Hayes Rich J and Hayes Sandra K
Home Financials for this Owner
Home Financials are based on the most recent Mortgage that was taken out on this home.
Original Mortgage
$228,025
Interest Rate
5.98%
Mortgage Type
New Conventional
Create a Home Valuation Report for This Property
The Home Valuation Report is an in-depth analysis detailing your home's value as well as a comparison with similar homes in the area
Home Values in the Area
Average Home Value in this Area
Purchase History
| Date | Buyer | Sale Price | Title Company |
|---|---|---|---|
| Poloock Paul Eugene | -- | -- | |
| Pollock Paul | $262,000 | -- | |
| Sirva Relocation Llc | $262,000 | -- | |
| Hayes Rich J | $243,100 | -- |
Source: Public Records
Mortgage History
| Date | Status | Borrower | Loan Amount |
|---|---|---|---|
| Previous Owner | Sirva Relocation Llc | $20,000 | |
| Previous Owner | Sirva Relocation Llc | $209,600 | |
| Previous Owner | Hayes Rich J | $228,025 |
Source: Public Records
Tax History Compared to Growth
Tax History
| Year | Tax Paid | Tax Assessment Tax Assessment Total Assessment is a certain percentage of the fair market value that is determined by local assessors to be the total taxable value of land and additions on the property. | Land | Improvement |
|---|---|---|---|---|
| 2025 | $5,320 | $190,560 | $35,840 | $154,720 |
| 2024 | $5,496 | $190,560 | $35,840 | $154,720 |
| 2023 | $5,496 | $190,560 | $35,840 | $154,720 |
| 2022 | $4,951 | $165,800 | $31,200 | $134,600 |
| 2021 | $4,352 | $133,560 | $24,400 | $109,160 |
| 2020 | $4,382 | $133,560 | $24,400 | $109,160 |
| 2019 | $3,734 | $109,240 | $24,400 | $84,840 |
| 2018 | $3,739 | $109,240 | $24,400 | $84,840 |
| 2016 | $3,576 | $100,800 | $15,200 | $85,600 |
| 2015 | $3,610 | $100,800 | $15,200 | $85,600 |
| 2014 | $3,210 | $85,760 | $15,200 | $70,560 |
Source: Public Records
Map
Nearby Homes
- 2264 Oak Falls Ln
- 2424 Pinnae Place
- 2732 Thompson Mill Rd
- 4642 Devencrest Ln Unit 1
- 4693 Devencrest Ln
- 4785 Nolans Ridge
- 2808 Turnwater St
- 4645 Spout Springs Rd
- 4732 Moon Chase Dr
- 4761 Moon Chase Dr
- 3088 Lantana Way
- 3138 Lantana Way
- 3134 Perimeter Cir
- 2342 Sparta Way
- 2724 Talley Ln
- 4728 Moon Hollow Ct
- 5704 Miravista Way
- 5213 Morrell Rd
- 5222 Morrell Rd
- 4162 Wyndham Ridge Ct Unit 3
- 2324 Oak Falls Ln
- 2304 Oak Falls Ln
- 2294 Oak Falls Ln
- 2334 Oak Falls Ln Unit 23
- 2334 Oak Falls Ln
- 2303 Oak Falls Ln
- 2313 Oak Falls Ln
- 2323 Oak Falls Ln
- 2284 Oak Falls Ln
- 2344 Oak Falls Ln
- 2293 Oak Falls Ln
- 2343 Oak Falls Ln
- 2283 Oak Falls Ln
- 2274 Oak Falls Ln
- 2354 Oak Falls Ln
- 2354 Oak Falls Ln Unit 2
- 2702 Duncans View Trace
- 2350 Pemberton Point Unit 1
- 2712 Duncans View Trace
- 2360 Pemberton Point Unit 2360