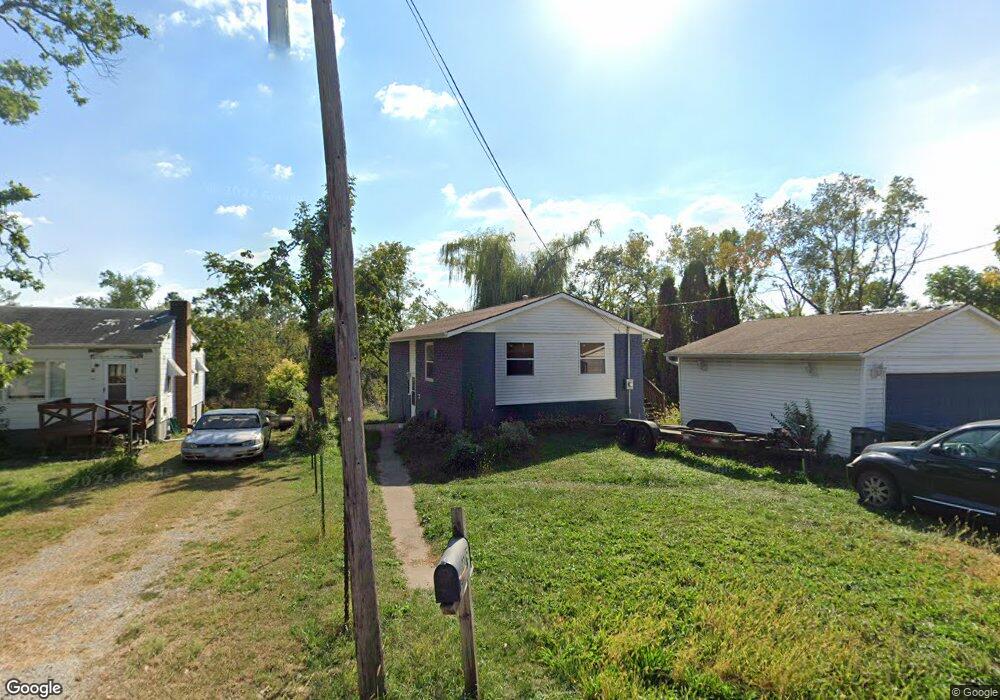
2315 Coldstream Ave NE Cedar Rapids, IA 52402
Estimated Value: $196,000 - $294,000
4
Beds
2
Baths
1,780
Sq Ft
$131/Sq Ft
Est. Value
About This Home
This home is located at 2315 Coldstream Ave NE, Cedar Rapids, IA 52402 and is currently estimated at $233,718, approximately $131 per square foot. 2315 Coldstream Ave NE is a home located in Linn County with nearby schools including Pierce Elementary School, Franklin Middle School, and John F. Kennedy High School.
Ownership History
Date
Name
Owned For
Owner Type
Purchase Details
Closed on
Oct 29, 2009
Sold by
Keller David D and Keller Amy L
Bought by
Vanfleet Justin
Current Estimated Value
Home Financials for this Owner
Home Financials are based on the most recent Mortgage that was taken out on this home.
Original Mortgage
$66,750
Outstanding Balance
$43,852
Interest Rate
5.12%
Mortgage Type
New Conventional
Estimated Equity
$189,866
Purchase Details
Closed on
Oct 29, 2004
Sold by
Morris Glenn R
Bought by
Keller David D and Keller Amy L
Home Financials for this Owner
Home Financials are based on the most recent Mortgage that was taken out on this home.
Original Mortgage
$93,600
Interest Rate
9.23%
Mortgage Type
Unknown
Purchase Details
Closed on
Sep 13, 2000
Sold by
Lamont Darin R and Lamont Michelle A
Bought by
Morris Glenn A
Home Financials for this Owner
Home Financials are based on the most recent Mortgage that was taken out on this home.
Original Mortgage
$76,000
Interest Rate
8.14%
Create a Home Valuation Report for This Property
The Home Valuation Report is an in-depth analysis detailing your home's value as well as a comparison with similar homes in the area
Home Values in the Area
Average Home Value in this Area
Purchase History
| Date | Buyer | Sale Price | Title Company |
|---|---|---|---|
| Vanfleet Justin | $88,500 | None Available | |
| Keller David D | $81,500 | -- | |
| Morris Glenn A | $95,000 | -- |
Source: Public Records
Mortgage History
| Date | Status | Borrower | Loan Amount |
|---|---|---|---|
| Open | Vanfleet Justin | $66,750 | |
| Previous Owner | Keller David D | $93,600 | |
| Previous Owner | Morris Glenn A | $76,000 |
Source: Public Records
Tax History Compared to Growth
Tax History
| Year | Tax Paid | Tax Assessment Tax Assessment Total Assessment is a certain percentage of the fair market value that is determined by local assessors to be the total taxable value of land and additions on the property. | Land | Improvement |
|---|---|---|---|---|
| 2025 | $3,036 | $201,300 | $37,800 | $163,500 |
| 2024 | $3,234 | $196,700 | $34,200 | $162,500 |
| 2023 | $3,234 | $182,000 | $34,200 | $147,800 |
| 2022 | $3,068 | $162,200 | $30,600 | $131,600 |
| 2021 | $3,240 | $157,100 | $30,600 | $126,500 |
| 2020 | $3,240 | $155,400 | $27,000 | $128,400 |
| 2019 | $2,980 | $146,800 | $27,000 | $119,800 |
| 2018 | $2,762 | $146,800 | $27,000 | $119,800 |
| 2017 | $2,587 | $123,600 | $27,000 | $96,600 |
| 2016 | $2,587 | $121,700 | $27,000 | $94,700 |
| 2015 | $2,415 | $113,509 | $21,615 | $91,894 |
| 2014 | $2,230 | $113,509 | $21,615 | $91,894 |
| 2013 | $2,178 | $113,509 | $21,615 | $91,894 |
Source: Public Records
Map
Nearby Homes
- 1759 Applewood Place NE
- 1724 Applewood Place NE
- 1724 Pikes Peak Ct NE Unit C
- 3008 Circle Hill Ct NE
- 1585 Matterhorn Dr NE
- 3100 Blue Ridge Ct NE
- 2962 Circle Dr NE
- 664 J Ave NE Unit A
- 618 J Ave NE
- 2445 Glass Rd NE
- 3130 Adirondack Dr NE
- 2113 Linmar Dr NE
- 2041 Birchwood Dr NE
- 310 McKinsie Ct NE
- 2226 Sierra Cir NE
- 2202 Sierra Cir NE
- 2219 Sierra Cir NE
- 2213 Sierra Cir NE
- 2122 Sierra Cir NE
- 2207 Sierra Cir NE
- 2323 Coldstream Ave NE
- 2309 Coldstream Ave NE
- 2308 Coldstream Ave NE
- 2268 Coldstream Ave NE
- 2327 Coldstream Ave NE
- 2316 Coldstream Ave NE
- 2264 Coldstream Ave NE
- 2320 Coldstream Ave NE
- 2260 Coldstream Ave NE
- 2261 Coldstream Ave NE
- 2326 Coldstream Ave NE
- 2248 Coldstream Ave NE
- 2332 Coldstream Ave NE
- 2341 Coldstream Ave NE
- 1745 Chestnut Ln NE
- 2338 Coldstream Ave NE
- 1739 Chestnut Ln NE
- 2357 Coldstream Ave NE
- 2240 Coldstream Ave NE
- 1733 Chestnut Ln NE