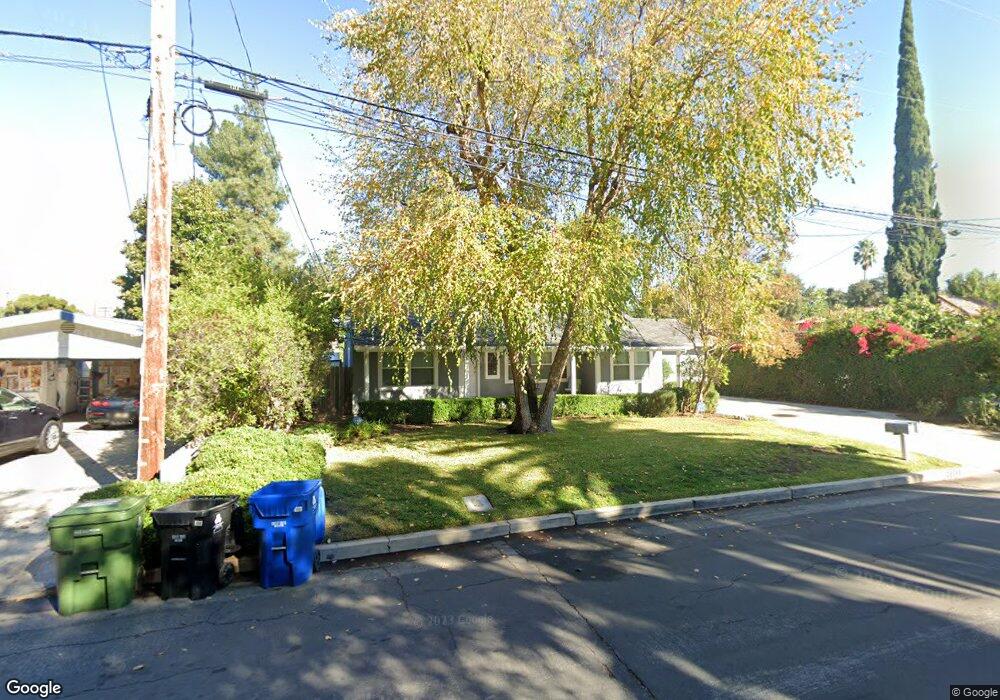
23153 Canzonet St Woodland Hills, CA 91367
Estimated Value: $1,012,969 - $1,345,000
3
Beds
2
Baths
1,195
Sq Ft
$954/Sq Ft
Est. Value
About This Home
This home is located at 23153 Canzonet St, Woodland Hills, CA 91367 and is currently estimated at $1,139,492, approximately $953 per square foot. 23153 Canzonet St is a home located in Los Angeles County with nearby schools including Woodlake Elementary Community Charter, Lockhurst Drive Charter Elementary, and Hale Charter Academy.
Ownership History
Date
Name
Owned For
Owner Type
Purchase Details
Closed on
Jan 22, 2008
Sold by
Real Salas Jacqueline M
Bought by
Janclaes John G
Current Estimated Value
Purchase Details
Closed on
Jul 21, 2003
Sold by
Janclaes John and Salas Jacqueline M Real
Bought by
Real Salas Jacqueline M
Home Financials for this Owner
Home Financials are based on the most recent Mortgage that was taken out on this home.
Original Mortgage
$237,500
Interest Rate
5.13%
Mortgage Type
Purchase Money Mortgage
Purchase Details
Closed on
Jun 16, 1994
Sold by
Pnc Mtg Bank Na
Bought by
Real Salas Jacqueline M
Home Financials for this Owner
Home Financials are based on the most recent Mortgage that was taken out on this home.
Original Mortgage
$153,800
Interest Rate
4.5%
Create a Home Valuation Report for This Property
The Home Valuation Report is an in-depth analysis detailing your home's value as well as a comparison with similar homes in the area
Home Values in the Area
Average Home Value in this Area
Purchase History
| Date | Buyer | Sale Price | Title Company |
|---|---|---|---|
| Janclaes John G | -- | None Available | |
| Real Salas Jacqueline M | -- | Old Republic Title Company | |
| Real Salas Jacqueline M | $170,909 | Guardian Title Company |
Source: Public Records
Mortgage History
| Date | Status | Borrower | Loan Amount |
|---|---|---|---|
| Closed | Real Salas Jacqueline M | $237,500 | |
| Previous Owner | Real Salas Jacqueline M | $153,800 |
Source: Public Records
Tax History Compared to Growth
Tax History
| Year | Tax Paid | Tax Assessment Tax Assessment Total Assessment is a certain percentage of the fair market value that is determined by local assessors to be the total taxable value of land and additions on the property. | Land | Improvement |
|---|---|---|---|---|
| 2025 | $3,686 | $287,028 | $210,450 | $76,578 |
| 2024 | $3,686 | $281,401 | $206,324 | $75,077 |
| 2023 | $3,619 | $275,884 | $202,279 | $73,605 |
| 2022 | $3,457 | $270,475 | $198,313 | $72,162 |
| 2021 | $3,412 | $265,173 | $194,425 | $70,748 |
| 2019 | $3,314 | $257,309 | $188,659 | $68,650 |
| 2018 | $3,208 | $252,264 | $184,960 | $67,304 |
| 2016 | $3,059 | $242,471 | $177,779 | $64,692 |
| 2015 | $3,016 | $238,830 | $175,109 | $63,721 |
| 2014 | $3,036 | $234,152 | $171,679 | $62,473 |
Source: Public Records
Map
Nearby Homes
- 23110 Canzonet St
- 23246 Canzonet St
- 23245 Gonzales Dr
- 23042 Ostronic Dr
- 23143 Leonora Dr
- 22963 Ostronic Dr
- 23003 Mariano St
- 23242 Burbank Blvd
- 23312 Ostronic Dr
- 22931 Dolorosa St
- 23151 Bigler St
- 5201 Rigoletto St
- 22942 Crespi St
- 22809 Del Valle St Unit 8
- 5350 Fallbrook Ave
- 23442 Burbank Blvd
- 4941 Rigoletto St
- 23346 Collins St
- 22910 Collins St
- 22723 Leonora Dr
- 23147 Canzonet St
- 5308 Woodlake Ave
- 23161 Canzonet St
- 23143 Canzonet St
- 5314 Woodlake Ave
- 5280 Woodlake Ave
- 5322 Woodlake Ave
- 23141 Gonzales Dr
- 23153 Gonzales Dr
- 23131 Canzonet St
- 5311 Woodlake Ave
- 5301 Woodlake Ave
- 5315 Woodlake Ave
- 23161 Gonzales Dr
- 5334 Woodlake Ave
- 5281 Woodlake Ave
- 5325 Woodlake Ave
- 23119 Canzonet St
- 23140 Gonzales Dr
- 23210 Ladrillo St