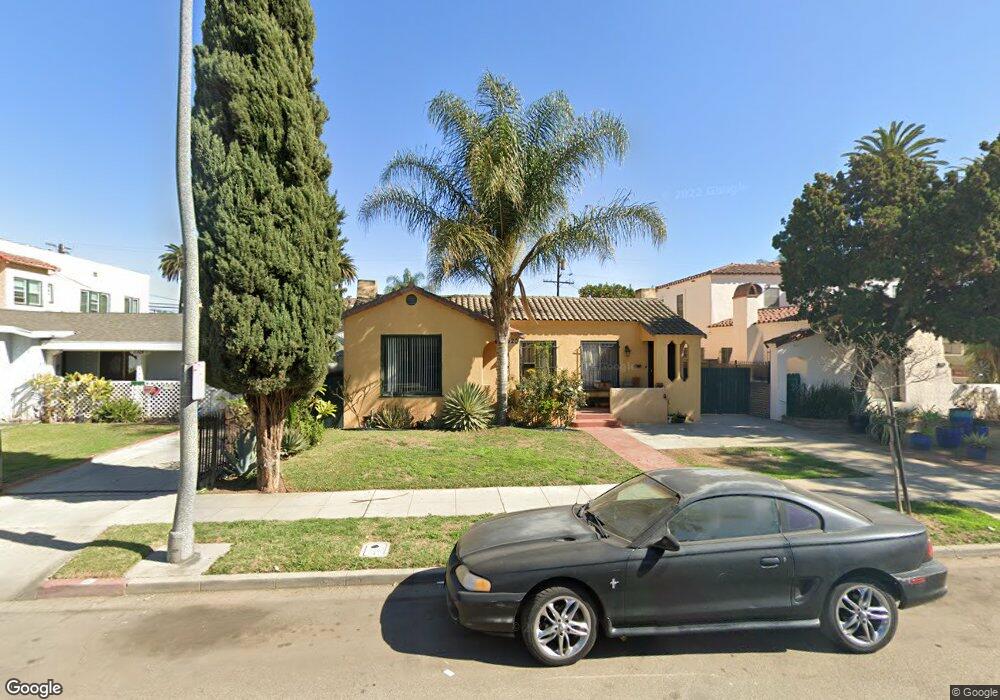
2316 Chestnut Ave Long Beach, CA 90806
South Wrigley NeighborhoodEstimated Value: $619,213 - $1,289,000
6
Beds
4
Baths
3,072
Sq Ft
$319/Sq Ft
Est. Value
About This Home
This home is located at 2316 Chestnut Ave, Long Beach, CA 90806 and is currently estimated at $981,053, approximately $319 per square foot. 2316 Chestnut Ave is a home located in Los Angeles County with nearby schools including Lafayette Elementary School, Washington Middle School, and Juan Rodriguez Cabrillo High School.
Ownership History
Date
Name
Owned For
Owner Type
Purchase Details
Closed on
Jun 8, 1998
Sold by
Vargas Luis and Cecena Vargas Michelle
Bought by
Vargas Luis A and Cecena Vargas Michelle
Current Estimated Value
Home Financials for this Owner
Home Financials are based on the most recent Mortgage that was taken out on this home.
Original Mortgage
$155,684
Interest Rate
7.17%
Mortgage Type
FHA
Purchase Details
Closed on
Aug 2, 1996
Sold by
Cecena Michelle
Bought by
Vargas Luis A
Home Financials for this Owner
Home Financials are based on the most recent Mortgage that was taken out on this home.
Original Mortgage
$157,976
Interest Rate
8.33%
Mortgage Type
FHA
Purchase Details
Closed on
Jul 2, 1996
Sold by
Anderson Helen Irene and Helen Irene Anderson Living Tr
Bought by
Vargas Luis A and Cecena Michelle
Home Financials for this Owner
Home Financials are based on the most recent Mortgage that was taken out on this home.
Original Mortgage
$157,976
Interest Rate
8.33%
Mortgage Type
FHA
Create a Home Valuation Report for This Property
The Home Valuation Report is an in-depth analysis detailing your home's value as well as a comparison with similar homes in the area
Home Values in the Area
Average Home Value in this Area
Purchase History
We collect this data history from publicly available records. To have your information removed, we recommend requesting removal directly through your county’s website.
| Date | Buyer | Sale Price | Title Company |
|---|---|---|---|
| Vargas Luis A | -- | Southland Title Corporation | |
| Vargas Luis A | -- | -- | |
| Vargas Luis A | $161,500 | Continental Lawyers Title Co |
Source: Public Records
Mortgage History
We collect this data history from publicly available records. To have your information removed, we recommend requesting removal directly through your county’s website.
| Date | Status | Borrower | Loan Amount |
|---|---|---|---|
| Previous Owner | Vargas Luis A | $155,684 | |
| Previous Owner | Vargas Luis A | $157,976 |
Source: Public Records
Tax History
| Year | Tax Paid | Tax Assessment Tax Assessment Total Assessment is a certain percentage of the fair market value that is determined by local assessors to be the total taxable value of land and additions on the property. | Land | Improvement |
|---|---|---|---|---|
| 2025 | $4,194 | $263,004 | $141,683 | $121,321 |
| 2024 | $4,007 | $257,848 | $138,905 | $118,943 |
| 2023 | $3,933 | $252,793 | $136,182 | $116,611 |
| 2022 | $3,713 | $247,837 | $133,512 | $114,325 |
| 2021 | $3,615 | $242,979 | $130,895 | $112,084 |
| 2019 | $3,562 | $235,773 | $127,013 | $108,760 |
| 2018 | $3,372 | $231,151 | $124,523 | $106,628 |
| 2016 | $3,094 | $222,178 | $119,689 | $102,489 |
| 2015 | $2,982 | $218,842 | $117,892 | $100,950 |
| 2014 | $2,983 | $214,556 | $115,583 | $98,973 |
Source: Public Records
Map
Nearby Homes
- 2240 Eucalyptus Ave
- 2175 Chestnut Ave
- 2444 Pacific Ave
- 201 E Eagle St
- 2030 Eucalyptus Ave
- 2459 Maine Ave
- 2320 Locust Ave
- 2045 Pine Ave
- 2129 Locust Ave
- 223 E Eagle St
- 2170 Golden Ave
- 2337 Long Beach Blvd
- 2553 Pine Ave
- 2000 Pacific Ave
- 1950 Magnolia Ave
- 2430 San Francisco Ave
- 2048 Golden Ave
- 1958 Pine Ave
- 1952 Pine Ave
- 2010 Golden Ave
- 400 W 23rd St
- 2285 Chestnut Ave
- 2301 Chestnut Ave
- 2290 Eucalyptus Ave
- 2271 Chestnut Ave
- 417 W 23rd St
- 2280 Eucalyptus Ave
- 2265 Chestnut Ave
- 421 W 23rd St
- 2309 Chestnut Ave
- 2280 Chestnut Ave Unit Pool House
- 2280 Chestnut Ave
- 2272 Eucalyptus Ave
- 2290 Chestnut Ave
- 2302 Chestnut Ave
- 2261 Chestnut Ave
- 2300 Eucalyptus Ave
- 2262 Eucalyptus Ave
- 2272 Chestnut Ave
- 2310 Eucalyptus Ave
Your Personal Tour Guide
Ask me questions while you tour the home.