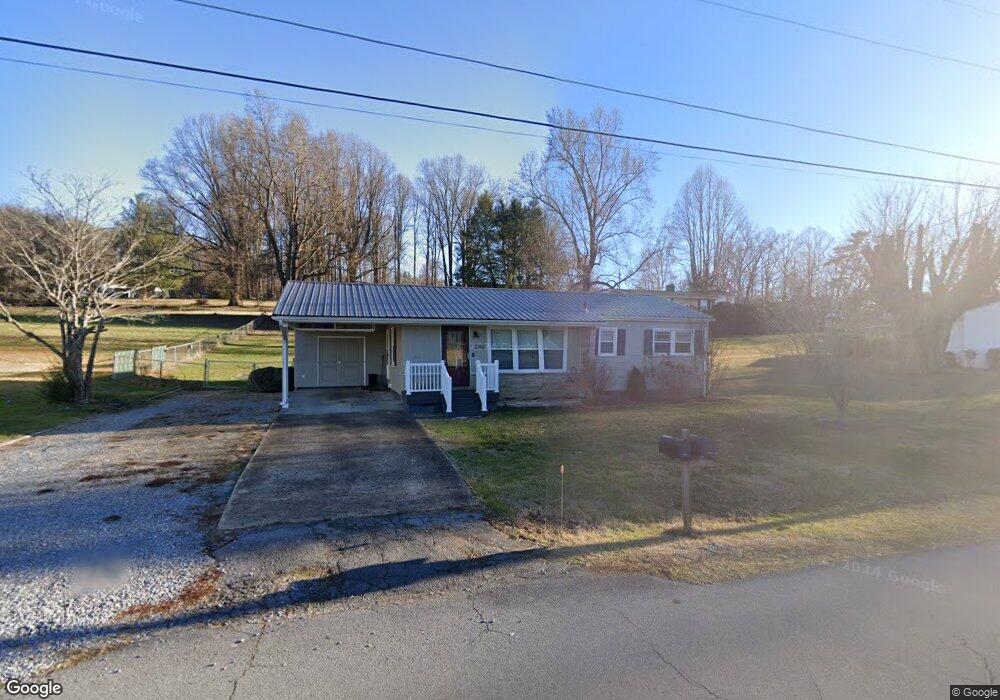
2316 Hillrise Ave Elizabethton, TN 37643
Estimated Value: $166,000 - $278,000
--
Bed
1
Bath
1,264
Sq Ft
$175/Sq Ft
Est. Value
About This Home
This home is located at 2316 Hillrise Ave, Elizabethton, TN 37643 and is currently estimated at $221,465, approximately $175 per square foot. 2316 Hillrise Ave is a home located in Carter County with nearby schools including Elizabethton High School and East Tn Christian Home & Academy.
Ownership History
Date
Name
Owned For
Owner Type
Purchase Details
Closed on
Oct 16, 2019
Sold by
Hyder Steven Trevor and Hyder Kala Denise
Bought by
Little Joseph P
Current Estimated Value
Home Financials for this Owner
Home Financials are based on the most recent Mortgage that was taken out on this home.
Original Mortgage
$105,600
Outstanding Balance
$92,321
Interest Rate
3.4%
Mortgage Type
New Conventional
Estimated Equity
$129,144
Purchase Details
Closed on
Jun 22, 2012
Sold by
Culler Sharon
Bought by
Hyder Kala Denise
Purchase Details
Closed on
Oct 1, 2009
Sold by
Johnson Montie Shannon
Bought by
Culler Kala
Home Financials for this Owner
Home Financials are based on the most recent Mortgage that was taken out on this home.
Original Mortgage
$54,003
Interest Rate
5.05%
Purchase Details
Closed on
Jun 3, 2009
Sold by
Veasey Debbie H
Bought by
Johnson Montie Shannon
Purchase Details
Closed on
Feb 29, 1968
Bought by
Harvey Gillespie A and Harvey Frances
Create a Home Valuation Report for This Property
The Home Valuation Report is an in-depth analysis detailing your home's value as well as a comparison with similar homes in the area
Home Values in the Area
Average Home Value in this Area
Purchase History
| Date | Buyer | Sale Price | Title Company |
|---|---|---|---|
| Little Joseph P | $132,000 | None Available | |
| Hyder Kala Denise | -- | -- | |
| Culler Kala | $55,000 | -- | |
| Johnson Montie Shannon | $35,000 | -- | |
| Harvey Gillespie A | -- | -- |
Source: Public Records
Mortgage History
| Date | Status | Borrower | Loan Amount |
|---|---|---|---|
| Open | Little Joseph P | $105,600 | |
| Previous Owner | Harvey Gillespie A | $54,003 |
Source: Public Records
Tax History Compared to Growth
Tax History
| Year | Tax Paid | Tax Assessment Tax Assessment Total Assessment is a certain percentage of the fair market value that is determined by local assessors to be the total taxable value of land and additions on the property. | Land | Improvement |
|---|---|---|---|---|
| 2024 | $1,114 | $33,750 | $8,300 | $25,450 |
| 2023 | $1,114 | $33,750 | $0 | $0 |
| 2022 | $1,215 | $33,750 | $8,300 | $25,450 |
| 2021 | $685 | $33,750 | $8,300 | $25,450 |
| 2020 | $1,114 | $32,000 | $8,300 | $23,700 |
| 2019 | $1,114 | $25,800 | $8,625 | $17,175 |
| 2018 | $1,099 | $25,800 | $8,625 | $17,175 |
| 2017 | $1,099 | $25,800 | $8,625 | $17,175 |
| 2016 | $1,094 | $25,800 | $8,625 | $17,175 |
| 2015 | $1,097 | $25,800 | $8,625 | $17,175 |
| 2014 | $1,061 | $24,850 | $8,625 | $16,225 |
Source: Public Records
Map
Nearby Homes
- 501 Golf Course Dr
- 0 Mary Patton Hwy
- 113 Wedgewood Cir
- 2026 W G St
- 660 Jena Beth Dr Unit 4
- 649 & 659 Gap Creek Rd
- 1906 W G St
- 121 Clark Dr
- 1809 Field Rd
- 201 Happy Valley Rd
- 1821 Woodhaven Dr
- 194 Sparks Rd
- 1735 Charlotte Dr
- 1728 Charlotte Dr
- 2504 Elizabethton Hwy
- Tbd Off Warrior Country Acres Ln
- 1614 Burgie St
- Tbd Tank Rd
- 1903 W G St
- 1436 W G St
- 2312 Hillrise Ave
- 500 Golf Course Dr
- 508 Golf Course Dr
- 2308 Hillrise Ave
- 2315 Hillrise Ave
- 2319 Hillrise Ave
- 510 Golf Course Dr
- 2311 Hillrise Ave
- 2323 Hillrise Ave
- 2307 Hillrise Ave
- 505 Golf Course Dr
- 507 Sabine St
- 514 Golf Course Dr
- 2300 Hillrise Ave
- 509 Golf Course Dr
- 425 Sabine St
- 511 Sabine St
- 2329 Hillrise Ave
- 421 Sabine St
- 515 Sabine St