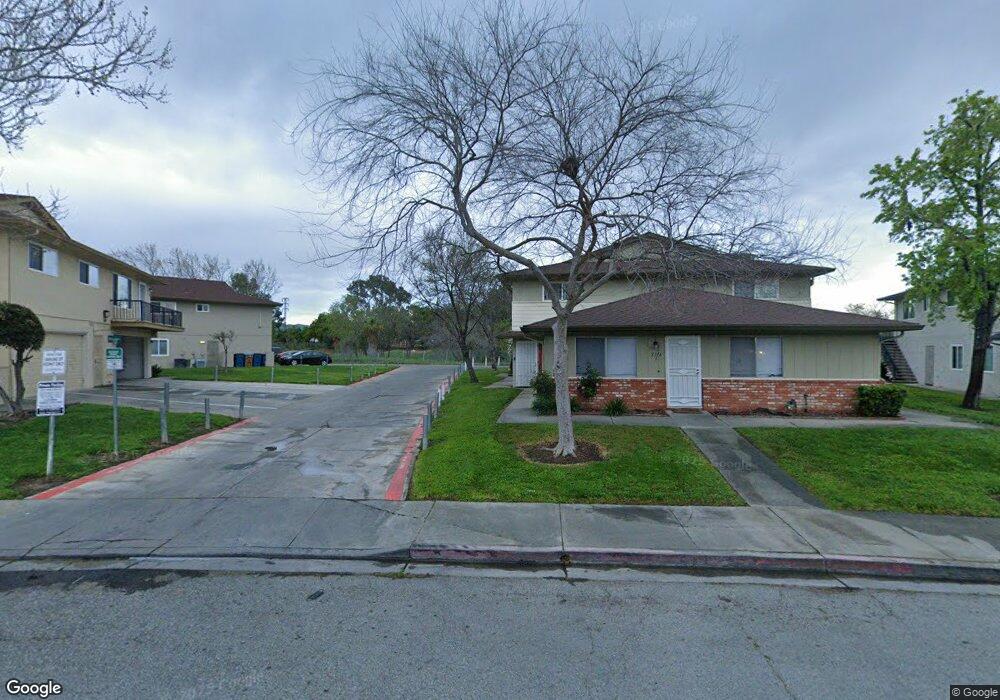
2316 Lemontree Way Unit 1 Antioch, CA 94509
North Antioch NeighborhoodEstimated Value: $154,000 - $173,000
2
Beds
1
Bath
822
Sq Ft
$202/Sq Ft
Est. Value
About This Home
This home is located at 2316 Lemontree Way Unit 1, Antioch, CA 94509 and is currently estimated at $165,817, approximately $201 per square foot. 2316 Lemontree Way Unit 1 is a home located in Contra Costa County with nearby schools including Marsh Elementary School, Park Middle School, and Antioch High School.
Ownership History
Date
Name
Owned For
Owner Type
Purchase Details
Closed on
Dec 27, 2012
Sold by
Charles Schwab Bank
Bought by
Niazi Khalid and Niazi Rani
Current Estimated Value
Purchase Details
Closed on
Dec 1, 2011
Sold by
Harris Roseanna C and Weaver Brian C
Bought by
Charles Schwab Bank
Purchase Details
Closed on
Jul 15, 2005
Sold by
Morales Santiago and Morales Maria
Bought by
Harris Roseanna C and Weaver Brian C
Home Financials for this Owner
Home Financials are based on the most recent Mortgage that was taken out on this home.
Original Mortgage
$220,500
Interest Rate
5.25%
Mortgage Type
Purchase Money Mortgage
Purchase Details
Closed on
Aug 28, 2001
Sold by
Salazar Manuel Guzman
Bought by
Morales Santiago and Morales Maria
Home Financials for this Owner
Home Financials are based on the most recent Mortgage that was taken out on this home.
Original Mortgage
$103,950
Interest Rate
7.09%
Mortgage Type
FHA
Create a Home Valuation Report for This Property
The Home Valuation Report is an in-depth analysis detailing your home's value as well as a comparison with similar homes in the area
Home Values in the Area
Average Home Value in this Area
Purchase History
| Date | Buyer | Sale Price | Title Company |
|---|---|---|---|
| Niazi Khalid | $50,000 | Chicago Title Company | |
| Charles Schwab Bank | $26,500 | Accommodation | |
| Harris Roseanna C | $245,000 | First American Title | |
| Harris Roseanna C | -- | First American Title | |
| Morales Santiago | $107,000 | Fidelity National Title Co |
Source: Public Records
Mortgage History
| Date | Status | Borrower | Loan Amount |
|---|---|---|---|
| Previous Owner | Harris Roseanna C | $220,500 | |
| Previous Owner | Morales Santiago | $103,950 |
Source: Public Records
Tax History Compared to Growth
Tax History
| Year | Tax Paid | Tax Assessment Tax Assessment Total Assessment is a certain percentage of the fair market value that is determined by local assessors to be the total taxable value of land and additions on the property. | Land | Improvement |
|---|---|---|---|---|
| 2025 | $1,203 | $61,555 | $14,768 | $46,787 |
| 2024 | $1,163 | $60,349 | $14,479 | $45,870 |
| 2023 | $1,163 | $59,167 | $14,196 | $44,971 |
| 2022 | $1,151 | $58,008 | $13,918 | $44,090 |
| 2021 | $1,107 | $56,872 | $13,646 | $43,226 |
| 2019 | $1,065 | $55,188 | $13,243 | $41,945 |
| 2018 | $1,027 | $54,107 | $12,984 | $41,123 |
| 2017 | $993 | $53,047 | $12,730 | $40,317 |
| 2016 | $950 | $52,008 | $12,481 | $39,527 |
| 2015 | $928 | $51,228 | $12,294 | $38,934 |
| 2014 | $894 | $50,226 | $12,054 | $38,172 |
Source: Public Records
Map
Nearby Homes
- 2304 Peppertree Way Unit 4
- 2205 Lemontree Way Unit 3
- 2118 Peppertree Way Unit 4
- 2404 Lemontree Ct Unit 1
- 2404 Peppertree Ct Unit 1
- 2104 Lemontree Way Unit 1
- 2101 Lemontree Way Unit 3
- 2101 L St
- 2410 Sunny Ln Unit 26
- 1707 Magnolia Way
- 1701 Mahogany Way Unit 38
- 1713 Magnolia Way
- 1707 Mahogany Way Unit 63
- 1412 Buchanan Rd
- 2416 Shadow Ln Unit 74
- 2788 Entrada Cir
- 1746 San Jose Dr
- 1016 San Carlos Dr
- 2400 Horizon Ln Unit 136
- 1017 W 14th St
- 2316 Lemontree Way Unit 4
- 2316 Lemontree Way Unit 3
- 2316 Lemontree Way Unit 2
- 2312 Lemontree Way
- 2312 Lemontree Way Unit 4
- 2312 Lemontree Way Unit 3
- 2312 Lemontree Way Unit 2
- 2312 Lemontree Way Unit 1
- 2400 Lemontree Ct Unit 4
- 2400 Lemontree Ct Unit 3
- 2400 Lemontree Ct Unit 2
- 2400 Lemontree Ct Unit 1
- 2317 Lemontree Way Unit 4
- 2317 Lemontree Way Unit 3
- 2317 Lemontree Way Unit 2
- 2317 Lemontree Way Unit 1
- 2404 Lemontree Ct
- 2404 Lemontree Ct Unit 4
- 2404 Lemontree Ct Unit 3
- 2404 Lemontree Ct Unit 2