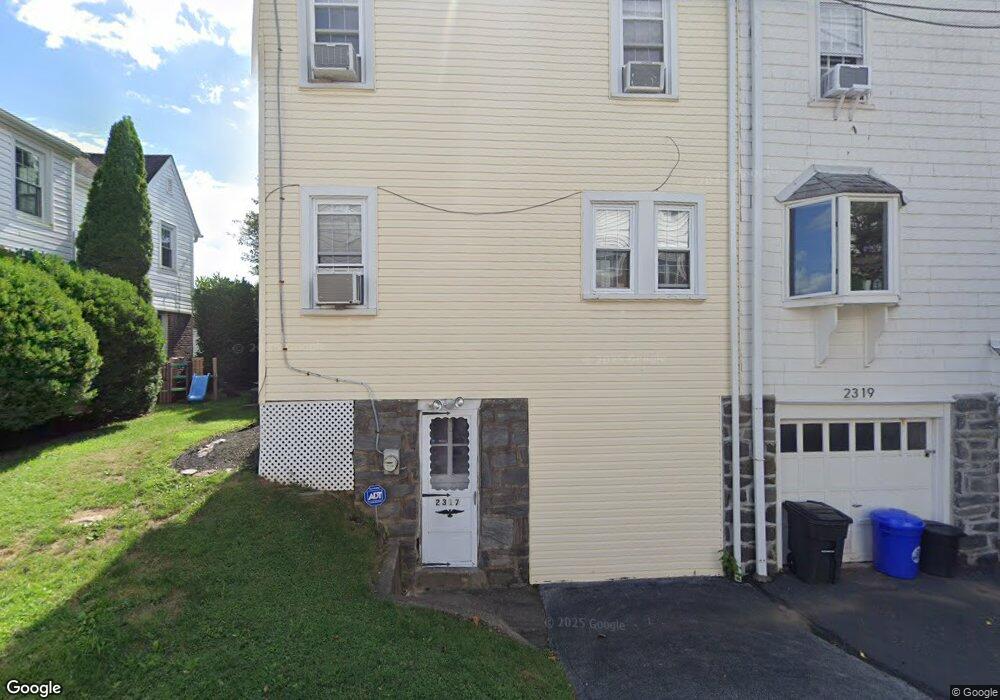
2317 Belmont Ave Ardmore, PA 19003
Estimated Value: $435,626 - $474,000
3
Beds
2
Baths
1,462
Sq Ft
$317/Sq Ft
Est. Value
About This Home
This home is located at 2317 Belmont Ave, Ardmore, PA 19003 and is currently estimated at $463,407, approximately $316 per square foot. 2317 Belmont Ave is a home located in Delaware County with nearby schools including Chestnutwold Elementary School, Haverford Middle School, and Haverford Senior High School.
Ownership History
Date
Name
Owned For
Owner Type
Purchase Details
Closed on
Aug 30, 2011
Sold by
Haggerty Ryan P and Haggerty Mabel Y
Bought by
Singh Judith E
Current Estimated Value
Home Financials for this Owner
Home Financials are based on the most recent Mortgage that was taken out on this home.
Original Mortgage
$207,000
Interest Rate
4.11%
Mortgage Type
New Conventional
Purchase Details
Closed on
Jun 28, 1999
Sold by
Moore Robert C and Moore Janet A
Bought by
Dano Christine
Home Financials for this Owner
Home Financials are based on the most recent Mortgage that was taken out on this home.
Original Mortgage
$102,800
Interest Rate
7.19%
Purchase Details
Closed on
May 26, 1994
Sold by
Smith Alex F and Smith Ann Kallen
Bought by
Moore Robert C and Moore Janet A
Home Financials for this Owner
Home Financials are based on the most recent Mortgage that was taken out on this home.
Original Mortgage
$102,000
Interest Rate
8.49%
Create a Home Valuation Report for This Property
The Home Valuation Report is an in-depth analysis detailing your home's value as well as a comparison with similar homes in the area
Home Values in the Area
Average Home Value in this Area
Purchase History
| Date | Buyer | Sale Price | Title Company |
|---|---|---|---|
| Singh Judith E | $230,000 | None Available | |
| Dano Christine | $128,500 | Commonwealth Land Title Ins | |
| Moore Robert C | $127,500 | -- |
Source: Public Records
Mortgage History
| Date | Status | Borrower | Loan Amount |
|---|---|---|---|
| Previous Owner | Singh Judith E | $207,000 | |
| Previous Owner | Dano Christine | $102,800 | |
| Previous Owner | Moore Robert C | $102,000 |
Source: Public Records
Tax History Compared to Growth
Tax History
| Year | Tax Paid | Tax Assessment Tax Assessment Total Assessment is a certain percentage of the fair market value that is determined by local assessors to be the total taxable value of land and additions on the property. | Land | Improvement |
|---|---|---|---|---|
| 2025 | $6,576 | $255,770 | $93,560 | $162,210 |
| 2024 | $6,576 | $255,770 | $93,560 | $162,210 |
| 2023 | $6,390 | $255,770 | $93,560 | $162,210 |
| 2022 | $6,240 | $255,770 | $93,560 | $162,210 |
| 2021 | $10,166 | $255,770 | $93,560 | $162,210 |
| 2020 | $5,529 | $118,960 | $47,380 | $71,580 |
| 2019 | $5,427 | $118,960 | $47,380 | $71,580 |
| 2018 | $5,334 | $118,960 | $0 | $0 |
| 2017 | $5,221 | $118,960 | $0 | $0 |
| 2016 | $653 | $118,960 | $0 | $0 |
| 2015 | $653 | $118,960 | $0 | $0 |
| 2014 | $653 | $118,960 | $0 | $0 |
Source: Public Records
Map
Nearby Homes
- 2222 Bryn Mawr Ave
- 2313 Haverford Rd
- 2409 Belmont Ave
- 2528 Rosemont Ave
- 421 E Eagle Rd
- 1525 W Wynnewood Rd
- 442 E Spring Ave
- 754 Oak View Rd
- 761 Hathaway Ln
- 231 Hastings Ave
- 139 Campbell Ave
- 2814 Saint Marys Rd
- 128 Campbell Ave
- 64 E Spring Ave
- 2919 Morris Rd
- 222 Lippincott Ave
- 140 Walnut Ave
- 2939 Berkley Rd
- 524 Sagamore Rd
- 433 Haverford Rd
- 2319 Belmont Ave
- 2315 Belmont Ave
- 2321 Belmont Ave
- 2313 Belmont Ave
- 2302 Bryn Mawr Ave
- 2323 Belmont Ave
- 2304 Bryn Mawr Ave
- 2311 Belmont Ave
- 2300 Bryn Mawr Ave
- 2306 Bryn Mawr Ave
- 2230 Bryn Mawr Ave
- 2316 Belmont Ave
- 2308 Bryn Mawr Ave
- 2318 Belmont Ave
- 2325 Belmont Ave
- 2314 Belmont Ave
- 2228 Bryn Mawr Ave
- 2320 Belmont Ave
- 2310 Bryn Mawr Ave
- 2307 Belmont Ave