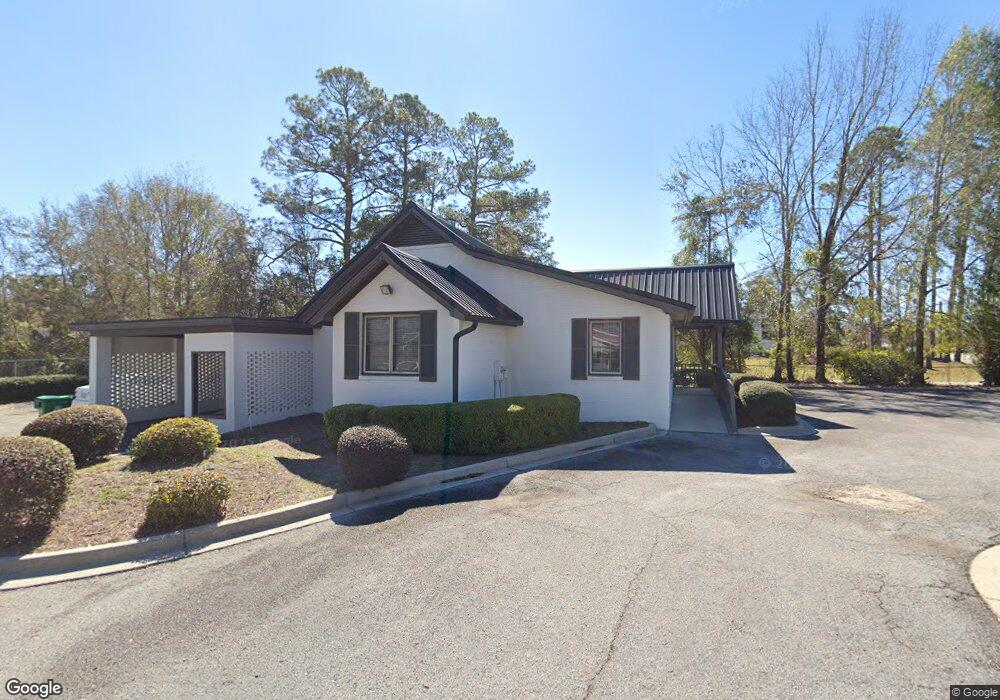
2317 Bemiss Rd Valdosta, GA 31602
Estimated Value: $314,040
--
Bed
--
Bath
2,023
Sq Ft
$155/Sq Ft
Est. Value
About This Home
This home is located at 2317 Bemiss Rd, Valdosta, GA 31602 and is currently estimated at $314,040, approximately $155 per square foot. 2317 Bemiss Rd is a home located in Lowndes County with nearby schools including Sallas Mahone Elementary School, Valdosta Middle School, and Valdosta High School.
Ownership History
Date
Name
Owned For
Owner Type
Purchase Details
Closed on
Jun 3, 2021
Sold by
Pyramid Properties Llc
Bought by
Pyramid Investment Properties Llc
Current Estimated Value
Purchase Details
Closed on
Sep 24, 2019
Sold by
Lower Lowndes Inc
Bought by
Pyramid Properties Llc
Purchase Details
Closed on
Sep 2, 2015
Sold by
Christie Emanuel
Bought by
Lower Lownder Inc
Home Financials for this Owner
Home Financials are based on the most recent Mortgage that was taken out on this home.
Original Mortgage
$136,900
Interest Rate
4.09%
Mortgage Type
New Conventional
Purchase Details
Closed on
Dec 19, 2003
Sold by
Christie Emanuel and Christie Jenn
Bought by
Christie Emanuel and Christie Jenn
Purchase Details
Closed on
Sep 30, 1988
Bought by
Christie Emanuel and Christie Jenn
Purchase Details
Closed on
May 12, 1987
Bought by
Smith James A and Smith Iris R
Purchase Details
Closed on
Mar 25, 1970
Bought by
Smith James A and Smith Iria R
Create a Home Valuation Report for This Property
The Home Valuation Report is an in-depth analysis detailing your home's value as well as a comparison with similar homes in the area
Home Values in the Area
Average Home Value in this Area
Purchase History
| Date | Buyer | Sale Price | Title Company |
|---|---|---|---|
| Pyramid Investment Properties Llc | -- | -- | |
| Pyramid Properties Llc | $185,000 | -- | |
| Lower Lownder Inc | $139,900 | -- | |
| Christie Emanuel | -- | -- | |
| Christie Emanuel | $84,000 | -- | |
| Smith James A | -- | -- | |
| Smith James A | -- | -- |
Source: Public Records
Mortgage History
| Date | Status | Borrower | Loan Amount |
|---|---|---|---|
| Previous Owner | Lower Lownder Inc | $136,900 |
Source: Public Records
Tax History Compared to Growth
Tax History
| Year | Tax Paid | Tax Assessment Tax Assessment Total Assessment is a certain percentage of the fair market value that is determined by local assessors to be the total taxable value of land and additions on the property. | Land | Improvement |
|---|---|---|---|---|
| 2024 | $2,187 | $78,302 | $19,800 | $58,502 |
| 2023 | $2,187 | $57,188 | $31,148 | $26,040 |
| 2022 | $1,933 | $57,188 | $31,148 | $26,040 |
| 2021 | $2,031 | $58,397 | $31,148 | $27,249 |
| 2020 | $2,117 | $59,607 | $31,148 | $28,459 |
| 2019 | $2,011 | $56,657 | $35,434 | $21,223 |
| 2018 | $2,037 | $56,657 | $35,434 | $21,223 |
| 2017 | $2,642 | $56,658 | $34,686 | $21,972 |
| 2016 | $2,023 | $94,821 | $52,562 | $42,259 |
| 2015 | $3,322 | $100,112 | $52,562 | $47,550 |
| 2014 | $2,420 | $71,723 | $23,361 | $48,362 |
Source: Public Records
Map
Nearby Homes
- 606 Randolph St
- 2413 Knox Dr
- 9 Oconee Place
- 607 Ledgedale Cir
- 904 Habersham Rd
- 2435 Muscogee Dr
- 0 Northside Dr Unit 145194
- 957 McAfina Trail
- 213 E Northside Dr
- 2712 Clayton Dr
- 2703 Bemiss Rd
- 2105 N Troup St
- 2414 Deborah Dr
- 3013 Kensington Ln
- 2517 Deborah Dr
- 300 Brookfield Rd
- 330 Brookfield Rd
- 1 Pomona Cir
- 2965 N Ashley St
- 309 Barfield Dr
- 2307 Bemiss Rd
- 2307 Bemiss Rd Unit 2
- 2307 Bemiss Rd Unit 5
- 2401 Bemiss Rd
- 2308 Dukes Ave
- 2306 Dukes Ave
- 2304 Dukes Ave
- 2305 Bemiss Rd
- 2302 Dukes Ave
- 2404 Bemiss Rd
- 2316 Bemiss Rd
- 2407 Bemiss Rd
- 2303 Bemiss Rd
- 2300 Dukes Ave
- 2406 Bemiss Rd Unit 6
- 2406 Bemiss Rd
- 2406 Bemiss Rd Unit R18
- 2406 Bemiss Rd Unit R17
- 2406 Bemiss Rd Unit R16
- 2406 Bemiss Rd Unit R15