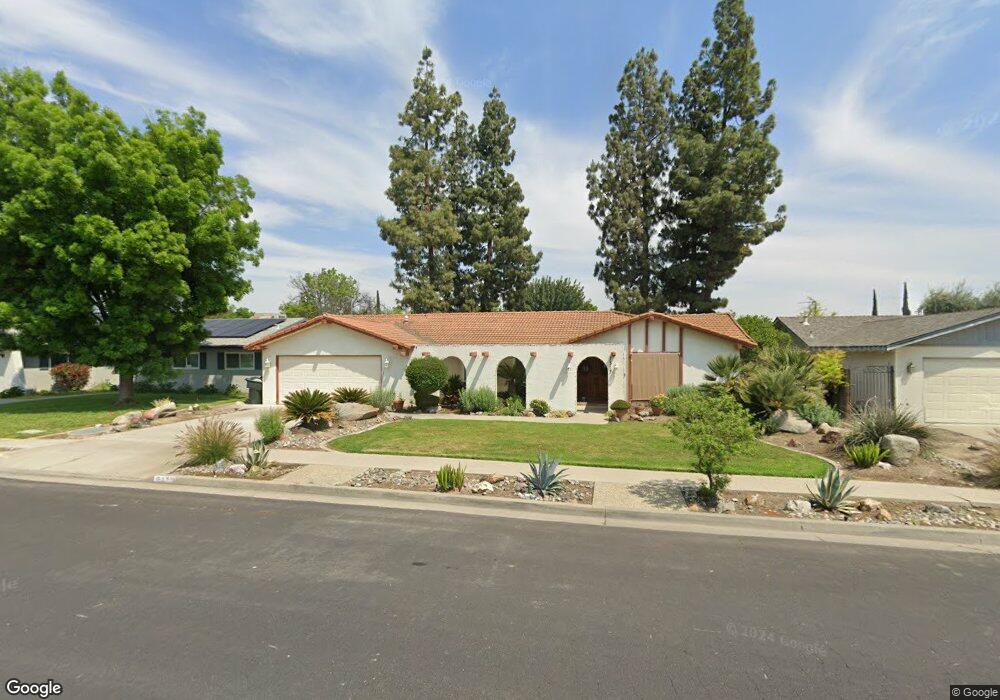
2317 Cabrillo Way Hanford, CA 93230
Estimated Value: $357,404 - $396,000
3
Beds
2
Baths
1,721
Sq Ft
$218/Sq Ft
Est. Value
About This Home
This home is located at 2317 Cabrillo Way, Hanford, CA 93230 and is currently estimated at $374,351, approximately $217 per square foot. 2317 Cabrillo Way is a home located in Kings County with nearby schools including Monroe Elementary School, Woodrow Wilson Junior High School, and Hanford High School.
Ownership History
Date
Name
Owned For
Owner Type
Purchase Details
Closed on
Aug 5, 2011
Sold by
Reyneveld Beatrice and Reyneveld Beatrice Revocable T
Bought by
Crider Kyle A and Crider Melissa L
Current Estimated Value
Home Financials for this Owner
Home Financials are based on the most recent Mortgage that was taken out on this home.
Original Mortgage
$174,000
Outstanding Balance
$119,856
Interest Rate
4.46%
Mortgage Type
New Conventional
Estimated Equity
$254,495
Purchase Details
Closed on
Feb 17, 2011
Sold by
Reyneveld Tarter Beatrice and Reyneveld Beatrice
Bought by
Reyneveld Beatrice and Reyneveld Beatrice Revocable T
Purchase Details
Closed on
Aug 11, 2008
Sold by
Reyneveld Tarter Beatrice and Reyneveld Beatrice
Bought by
Revo Reyneveld Tarter Beatrice and Revo Beatrice Reyneveld Tarter
Create a Home Valuation Report for This Property
The Home Valuation Report is an in-depth analysis detailing your home's value as well as a comparison with similar homes in the area
Home Values in the Area
Average Home Value in this Area
Purchase History
| Date | Buyer | Sale Price | Title Company |
|---|---|---|---|
| Crider Kyle A | $174,000 | Stewart Title Of California | |
| Reyneveld Beatrice | -- | None Available | |
| Revo Reyneveld Tarter Beatrice | -- | None Available |
Source: Public Records
Mortgage History
| Date | Status | Borrower | Loan Amount |
|---|---|---|---|
| Open | Crider Kyle A | $174,000 |
Source: Public Records
Tax History Compared to Growth
Tax History
| Year | Tax Paid | Tax Assessment Tax Assessment Total Assessment is a certain percentage of the fair market value that is determined by local assessors to be the total taxable value of land and additions on the property. | Land | Improvement |
|---|---|---|---|---|
| 2025 | $2,244 | $218,550 | $69,082 | $149,468 |
| 2023 | $2,244 | $210,065 | $66,400 | $143,665 |
| 2022 | $2,194 | $205,948 | $65,099 | $140,849 |
| 2021 | $2,145 | $201,911 | $63,823 | $138,088 |
| 2020 | $2,167 | $199,841 | $63,169 | $136,672 |
| 2019 | $2,130 | $195,922 | $61,930 | $133,992 |
| 2018 | $2,067 | $192,081 | $60,716 | $131,365 |
| 2017 | $2,034 | $188,314 | $59,525 | $128,789 |
| 2016 | $2,006 | $184,622 | $58,358 | $126,264 |
| 2015 | $1,992 | $181,848 | $57,481 | $124,367 |
| 2014 | $1,951 | $178,286 | $56,355 | $121,931 |
Source: Public Records
Map
Nearby Homes
- 165 W Magnolia Ave
- 314 W Birch Ave
- 496 W Earl Way
- 2234 Carter Way
- 285 W Ash Ave
- 2483 Aspen St
- 2127 N 11th Ave
- 2612 Aspen St
- 325 E Amber Way
- 2563 Spruce Ct
- 136 W Colonial Dr
- 2475 Santa Lucia Ct
- 332 E Ash Ave
- 225 W Colonial Dr
- 1967 Mulberry Dr
- 344 E Lemmon Way
- 405 E Magnolia Ave
- 240 W Terrace Dr
- 450 E Birch Ave
- 1900 Easy St
- 2303 Cabrillo Way
- 2339 Cabrillo Way
- 2316 Cabrillo Way
- 2302 Cabrillo Way
- 2338 Cabrillo Way
- 304 W Magnolia Ave
- 2353 Cabrillo Way
- 2330 Michael Cir
- 2352 Cabrillo Way
- 345 W Magnolia Ave
- 280 W Magnolia Ave
- 363 W Magnolia Ave
- 331 W Magnolia Ave
- 2361 Cabrillo Way
- 392 W Magnolia Ave
- 387 W Magnolia Ave
- 305 W Magnolia Ave
- 2317 Michael Cir
- 2360 Cabrillo Way
- 391 W Magnolia Ave