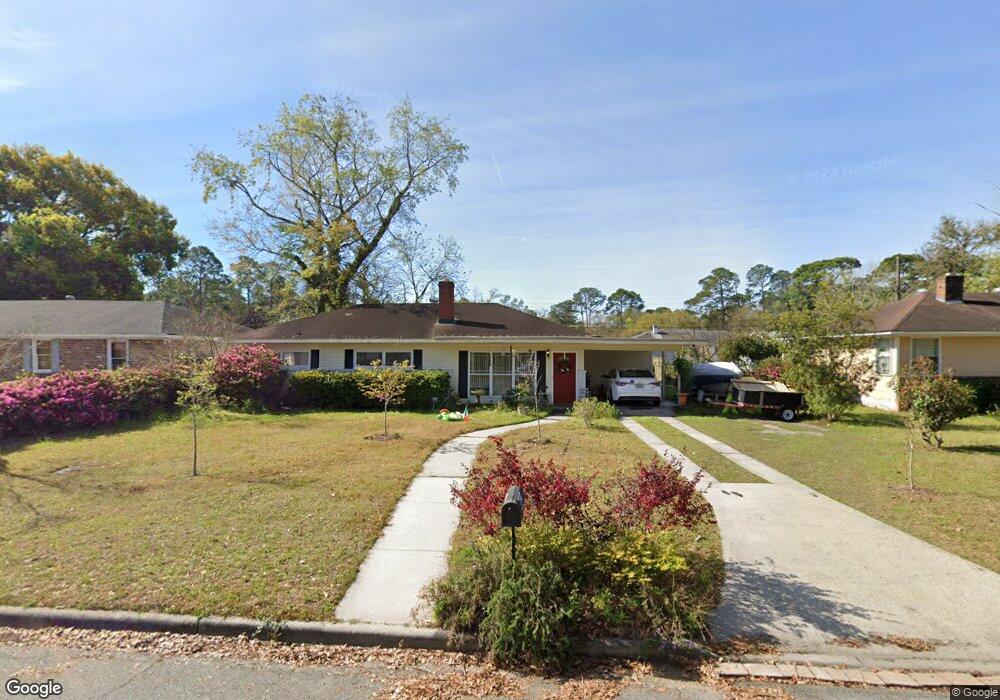
2317 Camelia Ct Savannah, GA 31404
LaRoche Park-Springhill-Daffin Heights NeighborhoodEstimated Value: $297,000 - $327,000
4
Beds
2
Baths
2,070
Sq Ft
$152/Sq Ft
Est. Value
About This Home
This home is located at 2317 Camelia Ct, Savannah, GA 31404 and is currently estimated at $313,834, approximately $151 per square foot. 2317 Camelia Ct is a home located in Chatham County with nearby schools including Myers Middle School, Jenkins High School, and Calvary Day School.
Ownership History
Date
Name
Owned For
Owner Type
Purchase Details
Closed on
Nov 14, 2013
Sold by
Scbt
Bought by
Hanovich Benjamin
Current Estimated Value
Home Financials for this Owner
Home Financials are based on the most recent Mortgage that was taken out on this home.
Original Mortgage
$75,000
Outstanding Balance
$56,108
Interest Rate
4.31%
Mortgage Type
New Conventional
Estimated Equity
$257,726
Purchase Details
Closed on
Oct 2, 2012
Sold by
Dl Real Estate Grp Llc
Bought by
The Savannah Bank
Purchase Details
Closed on
Nov 10, 2009
Sold by
Paul B Delevis Inc
Bought by
Dl Real Estate Grp Llc
Purchase Details
Closed on
Jan 28, 2008
Sold by
Not Provided
Bought by
Dl Real Estate Group Llc
Home Financials for this Owner
Home Financials are based on the most recent Mortgage that was taken out on this home.
Original Mortgage
$103,500
Interest Rate
6.17%
Mortgage Type
New Conventional
Create a Home Valuation Report for This Property
The Home Valuation Report is an in-depth analysis detailing your home's value as well as a comparison with similar homes in the area
Home Values in the Area
Average Home Value in this Area
Purchase History
| Date | Buyer | Sale Price | Title Company |
|---|---|---|---|
| Hanovich Benjamin | $76,400 | -- | |
| The Savannah Bank | $74,000 | -- | |
| Dl Real Estate Grp Llc | -- | -- | |
| Dl Real Estate Group Llc | $103,500 | -- |
Source: Public Records
Mortgage History
| Date | Status | Borrower | Loan Amount |
|---|---|---|---|
| Open | Hanovich Benjamin | $75,000 | |
| Previous Owner | Dl Real Estate Group Llc | $103,500 |
Source: Public Records
Tax History Compared to Growth
Tax History
| Year | Tax Paid | Tax Assessment Tax Assessment Total Assessment is a certain percentage of the fair market value that is determined by local assessors to be the total taxable value of land and additions on the property. | Land | Improvement |
|---|---|---|---|---|
| 2025 | $1,329 | $134,720 | $24,000 | $110,720 |
| 2024 | $1,329 | $107,520 | $16,000 | $91,520 |
| 2023 | $448 | $100,040 | $16,000 | $84,040 |
| 2022 | $627 | $80,360 | $8,720 | $71,640 |
| 2021 | $1,820 | $63,520 | $8,720 | $54,800 |
| 2020 | $1,222 | $56,800 | $8,720 | $48,080 |
| 2019 | $1,817 | $55,600 | $8,720 | $46,880 |
| 2018 | $1,205 | $54,640 | $8,720 | $45,920 |
| 2017 | $1,092 | $52,000 | $8,720 | $43,280 |
| 2016 | $1,072 | $44,080 | $8,720 | $35,360 |
| 2015 | $1,609 | $45,160 | $8,720 | $36,440 |
| 2014 | $2,166 | $42,360 | $0 | $0 |
Source: Public Records
Map
Nearby Homes
- 2338 Lorraine Dr
- 2309 Lorraine Dr
- 2237 Mason Dr
- 2327 Toussaint Ave
- 2332 Walz Dr
- 55 S Parkwood Dr
- 1918 E 63rd St
- 128 Walz Cir
- 2208 Lorraine Ct
- 2223 Armstrong Dr
- 2113 Glynnwood Dr
- 2229 Walz Dr
- 2221 Walz Dr
- 2044 E 60th St
- 2207 Mason Dr
- 4903 La Roche Ave
- 46 S Parkwood Dr
- 113 Walz Cir
- 1907 E 64th St
- 2004 N Fernwood Dr
- 2321 Camelia Ct
- 2313 Camelia Ct
- 2354 Pinetree Rd
- 2309 Camelia Ct
- 2358 Pinetree Rd
- 2325 Camelia Ct
- 2348 Pinetree Rd
- 2344 Pinetree Rd
- 2318 Camelia Ct
- 2322 Camelia Ct
- 2314 Camelia Ct
- 2310 Camelia Ct
- 2360 Pinetree Rd
- 2305 Camelia Ct
- 2326 Camelia Ct
- 2329 Camelia Ct
- 0 Pinetree Rd Unit 8328457
- 0 Pinetree Rd Unit 8311676
- 2340 Pinetree Rd
- 2366 Pinetree Rd