2317 Elk Pointe Ln Overgaard, AZ 85933
Estimated Value: $569,822 - $780,000
Studio
--
Bath
2,504
Sq Ft
$266/Sq Ft
Est. Value
About This Home
This home is located at 2317 Elk Pointe Ln, Overgaard, AZ 85933 and is currently estimated at $665,206, approximately $265 per square foot. 2317 Elk Pointe Ln is a home with nearby schools including Mountain Meadows Primary School, Mogollon Junior High School, and Mogollon High School.
Ownership History
Date
Name
Owned For
Owner Type
Purchase Details
Closed on
Nov 24, 2015
Sold by
Clark Lenny C and Clark Julia A
Bought by
The Lanny C Clark & Julia A Clark Trust
Current Estimated Value
Purchase Details
Closed on
Nov 11, 2015
Sold by
Clark Lenny C and Clark Julia A
Bought by
Clark Lenny C and Clark Julia A
Purchase Details
Closed on
Jun 22, 2009
Sold by
Clark Lenny C and Clark Julia A
Bought by
Clark Lenny C and Clark Julia A
Home Financials for this Owner
Home Financials are based on the most recent Mortgage that was taken out on this home.
Original Mortgage
$292,000
Interest Rate
3.76%
Mortgage Type
New Conventional
Purchase Details
Closed on
Jun 10, 2009
Sold by
Clark Julia A and Clark Lenny C
Bought by
Clark Lenny C and Clark Julia A
Home Financials for this Owner
Home Financials are based on the most recent Mortgage that was taken out on this home.
Original Mortgage
$292,000
Interest Rate
3.76%
Mortgage Type
New Conventional
Create a Home Valuation Report for This Property
The Home Valuation Report is an in-depth analysis detailing your home's value as well as a comparison with similar homes in the area
Home Values in the Area
Average Home Value in this Area
Purchase History
We collect this data history from publicly available records. To have your information removed, we recommend requesting removal directly through your county’s website.
| Date | Buyer | Sale Price | Title Company |
|---|---|---|---|
| The Lanny C Clark & Julia A Clark Trust | -- | Pioneer Title Agency | |
| Clark Lenny C | -- | Pioneer Title Agency | |
| Clark Lenny C | -- | Pioneer Title Agency | |
| Clark Lenny C | -- | Pioneer Title Agency |
Source: Public Records
Mortgage History
We collect this data history from publicly available records. To have your information removed, we recommend requesting removal directly through your county’s website.
| Date | Status | Borrower | Loan Amount |
|---|---|---|---|
| Closed | Clark Lenny C | $292,000 |
Source: Public Records
Tax History
| Year | Tax Paid | Tax Assessment Tax Assessment Total Assessment is a certain percentage of the fair market value that is determined by local assessors to be the total taxable value of land and additions on the property. | Land | Improvement |
|---|---|---|---|---|
| 2026 | $3,325 | -- | -- | -- |
| 2025 | $3,241 | $59,939 | $6,334 | $53,605 |
| 2024 | $3,091 | $62,670 | $6,939 | $55,731 |
| 2023 | $3,241 | $45,080 | $5,079 | $40,001 |
| 2022 | $3,091 | $0 | $0 | $0 |
| 2021 | $3,055 | $0 | $0 | $0 |
| 2020 | $2,968 | $0 | $0 | $0 |
| 2019 | $2,717 | $0 | $0 | $0 |
| 2018 | $2,592 | $0 | $0 | $0 |
| 2017 | $2,498 | $0 | $0 | $0 |
| 2016 | $2,379 | $0 | $0 | $0 |
| 2015 | $2,217 | $21,789 | $4,784 | $17,005 |
Source: Public Records
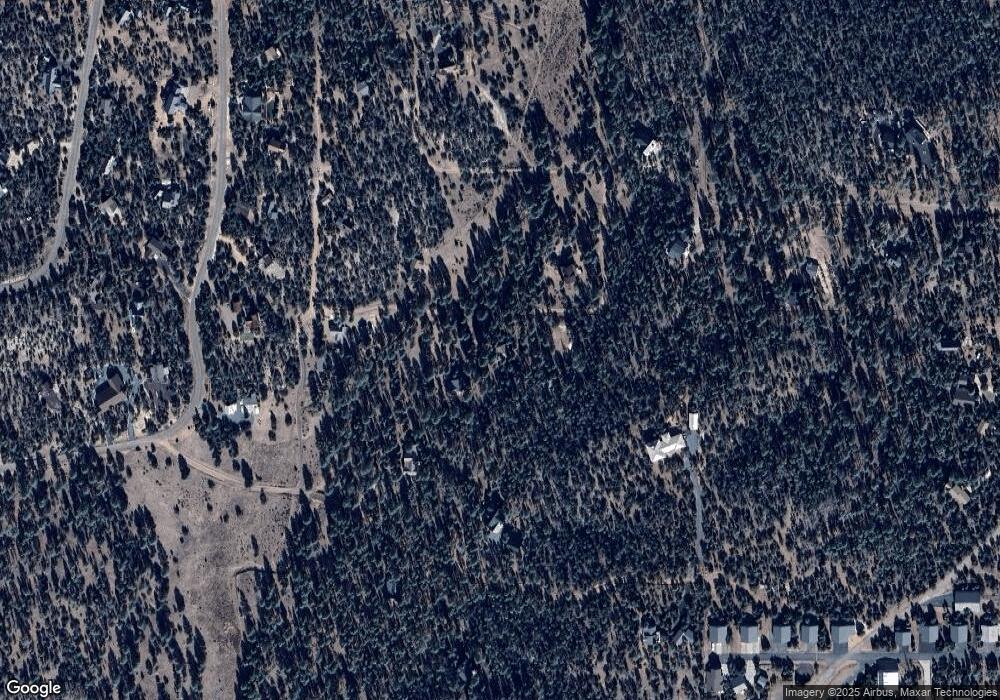
Map
Nearby Homes
- 2968 Constellation 029 Ln
- 2333 Elk Ridge Ln
- 2333 Elk Ridge Ln Unit 4H
- 2968 Constellation 028 Ln
- 2371 Florian Meadow Trail
- 2940 Constellation Ln
- 2943 E Lookout Ln
- 2277 Sunrise Rd Unit 361
- 2277 Sunrise Rd
- 2268 Roundabout Cir
- 2832 Lazy Eight Ct
- 2824 Constellation Rd Unit 18-12&13
- 2854 Thunderbird Way
- 2306 Thunderbird Cir
- 3166 Chevelon Rd
- 2836 Homestead Dr
- 2236 Roundabout Way
- 2344 Hellcat Cir
- 2276 Thunderbird Way
- 2881 Lodgepole Rd
- 2321 Elk Pointe Ln
- 2313 Elk Pointe Ln
- 2330 Elk Pointe Ln
- 6D Elk Pointe
- 2308 Elk Pointe Ln
- 2306 Elk Ridge Ln
- 2322 Elk Ridge Ln
- 2344 Elk Ridge Ln Unit 4R
- 2344 Elk Ridge Ln
- 2309 Elk Pointe Ln
- 2305 Elk Pointe Ln
- 2343 Florian Meadow Trail
- 2306 Elk Pointe Ln
- 2306 Elk Pointe Ln
- 2333 Florian Meadow Trail
- 2957 Ranch House Rd
- 2949 Ranch House Rd
- 2307 Elk Ridge Ln
- 2961 Ranch House Rd
- 2965 Ranch House Rd
Your Personal Tour Guide
Ask me questions while you tour the home.