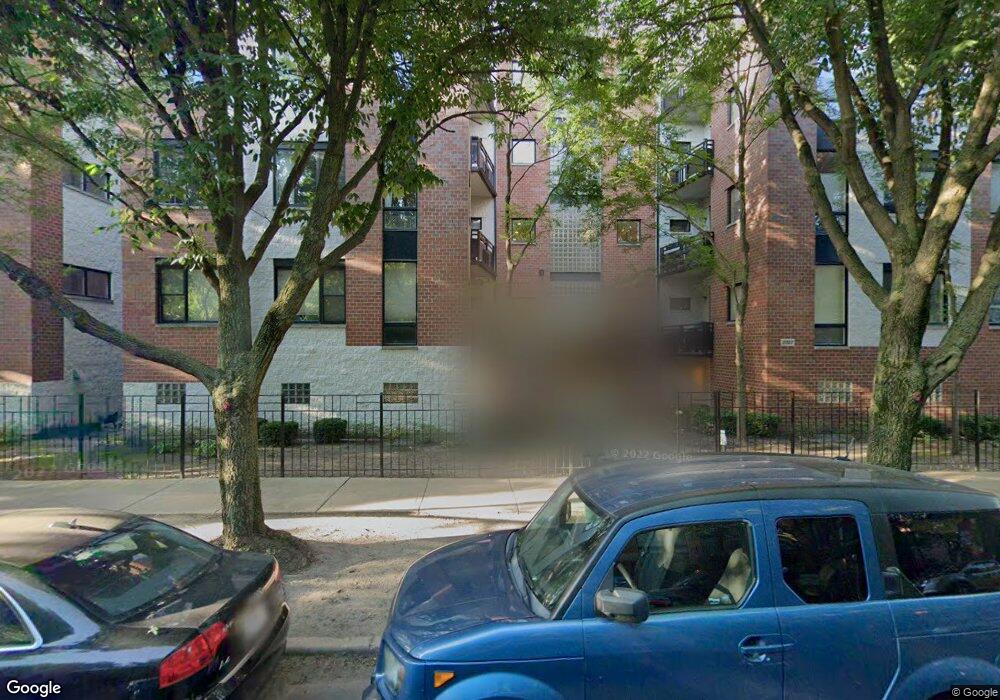
2317 W Wolfram St Unit PHASE2 Chicago, IL 60618
Bucktown NeighborhoodEstimated Value: $399,219 - $438,000
--
Bed
--
Bath
--
Sq Ft
1.22
Acres
About This Home
This home is located at 2317 W Wolfram St Unit PHASE2, Chicago, IL 60618 and is currently estimated at $420,305. 2317 W Wolfram St Unit PHASE2 is a home located in Cook County with nearby schools including Brentano Math & Science Academy, Schurz High School, and Acero Charter - Carlos Fuentes Cmpus.
Ownership History
Date
Name
Owned For
Owner Type
Purchase Details
Closed on
Jun 29, 2012
Sold by
Amalgamated Bank Of Chicago
Bought by
Shank Ann C and Shank Richard R
Current Estimated Value
Home Financials for this Owner
Home Financials are based on the most recent Mortgage that was taken out on this home.
Original Mortgage
$177,200
Outstanding Balance
$122,896
Interest Rate
3.77%
Mortgage Type
New Conventional
Estimated Equity
$297,409
Purchase Details
Closed on
Feb 8, 2012
Sold by
Rowe Ronda and Cirimele Ronda
Bought by
Amalgamated Bank Of Chicago
Purchase Details
Closed on
Mar 5, 2002
Sold by
Towers Wolfram
Bought by
Rowe Rhonda
Home Financials for this Owner
Home Financials are based on the most recent Mortgage that was taken out on this home.
Original Mortgage
$245,000
Interest Rate
6.92%
Mortgage Type
Purchase Money Mortgage
Create a Home Valuation Report for This Property
The Home Valuation Report is an in-depth analysis detailing your home's value as well as a comparison with similar homes in the area
Home Values in the Area
Average Home Value in this Area
Purchase History
| Date | Buyer | Sale Price | Title Company |
|---|---|---|---|
| Shank Ann C | $221,500 | Cti | |
| Amalgamated Bank Of Chicago | -- | None Available | |
| Rowe Rhonda | -- | 1St American Title |
Source: Public Records
Mortgage History
| Date | Status | Borrower | Loan Amount |
|---|---|---|---|
| Open | Shank Ann C | $177,200 | |
| Previous Owner | Rowe Rhonda | $245,000 |
Source: Public Records
Tax History Compared to Growth
Tax History
| Year | Tax Paid | Tax Assessment Tax Assessment Total Assessment is a certain percentage of the fair market value that is determined by local assessors to be the total taxable value of land and additions on the property. | Land | Improvement |
|---|---|---|---|---|
| 2024 | $5,326 | $33,868 | $4,414 | $29,454 |
| 2023 | $5,169 | $28,470 | $2,029 | $26,441 |
| 2022 | $5,169 | $28,470 | $2,029 | $26,441 |
| 2021 | $5,072 | $28,468 | $2,028 | $26,440 |
| 2020 | $5,169 | $26,222 | $2,028 | $24,194 |
| 2019 | $5,156 | $28,999 | $2,028 | $26,971 |
| 2018 | $5,050 | $28,999 | $2,028 | $26,971 |
| 2017 | $4,345 | $23,558 | $1,779 | $21,779 |
| 2016 | $4,218 | $23,558 | $1,779 | $21,779 |
| 2015 | $3,836 | $23,558 | $1,779 | $21,779 |
| 2014 | $3,172 | $19,666 | $1,441 | $18,225 |
| 2013 | $3,577 | $19,666 | $1,441 | $18,225 |
Source: Public Records
Map
Nearby Homes
- 2312 W Wolfram St
- 2327 W Wolfram St Unit 311
- 2337 W Wolfram St Unit 415
- 2801 N Oakley Ave Unit 202
- 2235 W Oakdale Ave Unit 4-D
- 2235 W Oakdale Ave Unit 21-B
- 2235 W Oakdale Ave Unit 8-D
- 2235 W Oakdale Ave Unit 6-D
- 2235 W Oakdale Ave Unit 22-C
- 2235 W Oakdale Ave Unit 18-B
- 2235 W Oakdale Ave Unit 7-D
- 2235 W Oakdale Ave Unit 5-D
- 2235 W Oakdale Ave Unit 15-C
- 2235 W Oakdale Ave Unit 3-D
- 2911 N Western Ave Unit 513
- 2811 N Bell Ave Unit 202
- 2811 N Bell Ave Unit 107
- 2222 W Diversey Ave Unit 407
- 2214 W Oakdale Ave
- 2444 W Diversey Ave Unit 1W
- 2317 W Wolfram St Unit 314
- 2317 W Wolfram St Unit 512
- 2317 W Wolfram St Unit 413
- 2317 W Wolfram St Unit 212
- 2317 W Wolfram St Unit PHASE2
- 2317 W Wolfram St Unit PHASE2
- 2317 W Wolfram St Unit PHASE2
- 2317 W Wolfram St Unit PHASE2
- 2317 W Wolfram St Unit PHASE2
- 2317 W Wolfram St Unit PHASE2
- 2317 W Wolfram St Unit PHASE2
- 2317 W Wolfram St Unit PHASE2
- 2317 W Wolfram St Unit PHASE2
- 2317 W Wolfram St Unit PHASE2
- 2317 W Wolfram St Unit PHASE2
- 2317 W Wolfram St Unit PHASE2
- 2317 W Wolfram St Unit PHASE2
- 2317 W Wolfram St Unit PHASE2
- 2317 W Wolfram St Unit PHASE2
- 2317 W Wolfram St Unit PHASE2