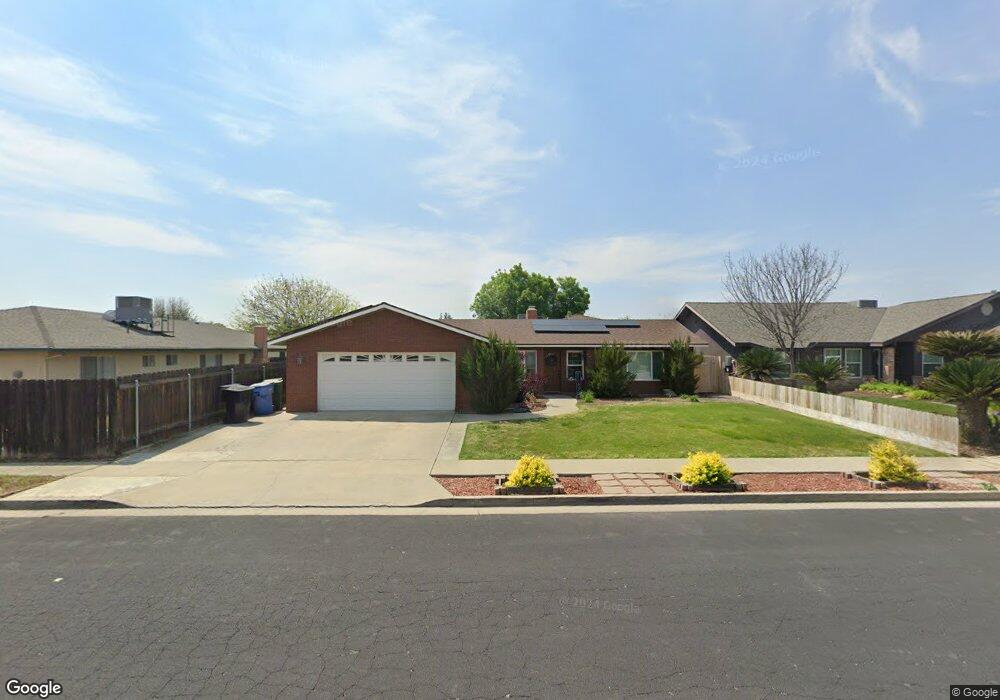
2318 Aspen St Hanford, CA 93230
Estimated Value: $385,000 - $405,000
3
Beds
2
Baths
1,909
Sq Ft
$206/Sq Ft
Est. Value
About This Home
This home is located at 2318 Aspen St, Hanford, CA 93230 and is currently estimated at $393,708, approximately $206 per square foot. 2318 Aspen St is a home located in Kings County with nearby schools including Monroe Elementary School, Woodrow Wilson Junior High School, and Hanford High School.
Ownership History
Date
Name
Owned For
Owner Type
Purchase Details
Closed on
Apr 3, 2020
Sold by
Smith Lionel C
Bought by
Smith Lionel C and Smith Julie
Current Estimated Value
Home Financials for this Owner
Home Financials are based on the most recent Mortgage that was taken out on this home.
Original Mortgage
$226,453
Outstanding Balance
$197,862
Interest Rate
2.7%
Mortgage Type
New Conventional
Estimated Equity
$195,846
Purchase Details
Closed on
Jan 29, 2007
Sold by
Smith Perla L
Bought by
Smith Lionel C
Purchase Details
Closed on
Mar 24, 2003
Sold by
Obligar Bienvenido and Obligar Lily
Bought by
Smith Lionel C and Smith Perla L
Home Financials for this Owner
Home Financials are based on the most recent Mortgage that was taken out on this home.
Original Mortgage
$205,975
Interest Rate
5.72%
Create a Home Valuation Report for This Property
The Home Valuation Report is an in-depth analysis detailing your home's value as well as a comparison with similar homes in the area
Home Values in the Area
Average Home Value in this Area
Purchase History
| Date | Buyer | Sale Price | Title Company |
|---|---|---|---|
| Smith Lionel C | -- | First American Title Ins Co | |
| Smith Lionel C | -- | None Available | |
| Smith Lionel C | $192,500 | Chicago Title Company |
Source: Public Records
Mortgage History
| Date | Status | Borrower | Loan Amount |
|---|---|---|---|
| Open | Smith Lionel C | $226,453 | |
| Previous Owner | Smith Lionel C | $205,975 |
Source: Public Records
Tax History Compared to Growth
Tax History
| Year | Tax Paid | Tax Assessment Tax Assessment Total Assessment is a certain percentage of the fair market value that is determined by local assessors to be the total taxable value of land and additions on the property. | Land | Improvement |
|---|---|---|---|---|
| 2025 | $2,896 | $280,026 | $57,930 | $222,096 |
| 2023 | $2,896 | $269,155 | $55,682 | $213,473 |
| 2022 | $2,833 | $263,879 | $54,591 | $209,288 |
| 2021 | $2,770 | $258,706 | $53,521 | $205,185 |
| 2020 | $2,799 | $256,053 | $52,972 | $203,081 |
| 2019 | $2,751 | $251,032 | $51,933 | $199,099 |
| 2018 | $2,658 | $245,032 | $50,915 | $194,117 |
| 2017 | $2,616 | $240,228 | $49,917 | $190,311 |
| 2016 | $2,580 | $235,517 | $48,938 | $186,579 |
| 2015 | $2,563 | $231,979 | $48,203 | $183,776 |
| 2014 | $2,511 | $227,435 | $47,259 | $180,176 |
Source: Public Records
Map
Nearby Homes
- 496 W Earl Way
- 314 W Birch Ave
- 2483 Aspen St
- 285 W Ash Ave
- 165 W Magnolia Ave
- 2234 Carter Way
- 2612 Aspen St
- 2127 N 11th Ave
- 2563 Spruce Ct
- 1967 Mulberry Dr
- 710 Northstar Dr
- 136 W Colonial Dr
- 2475 Santa Lucia Ct
- 225 W Colonial Dr
- 325 E Amber Way
- 332 E Ash Ave
- 795 Laurence Ln
- 240 W Terrace Dr
- 405 E Magnolia Ave
- 1900 Easy St
- 2334 Aspen St
- 414 W Magnolia Ave
- 2319 Aspen St
- 2335 Aspen St
- 2356 Aspen St
- 2315 Pine St
- 2333 Pine St
- 480 W Magnolia Ave
- 2357 Aspen St
- 425 W Magnolia Ave
- 2355 Pine St
- 392 W Magnolia Ave
- 2362 Aspen St
- 397 W Magnolia Ave
- 467 W Magnolia Ave
- 403 W Magnolia Ave
- 2363 Aspen St
- 489 W Magnolia Ave
- 2370 Aspen St
- 391 W Magnolia Ave