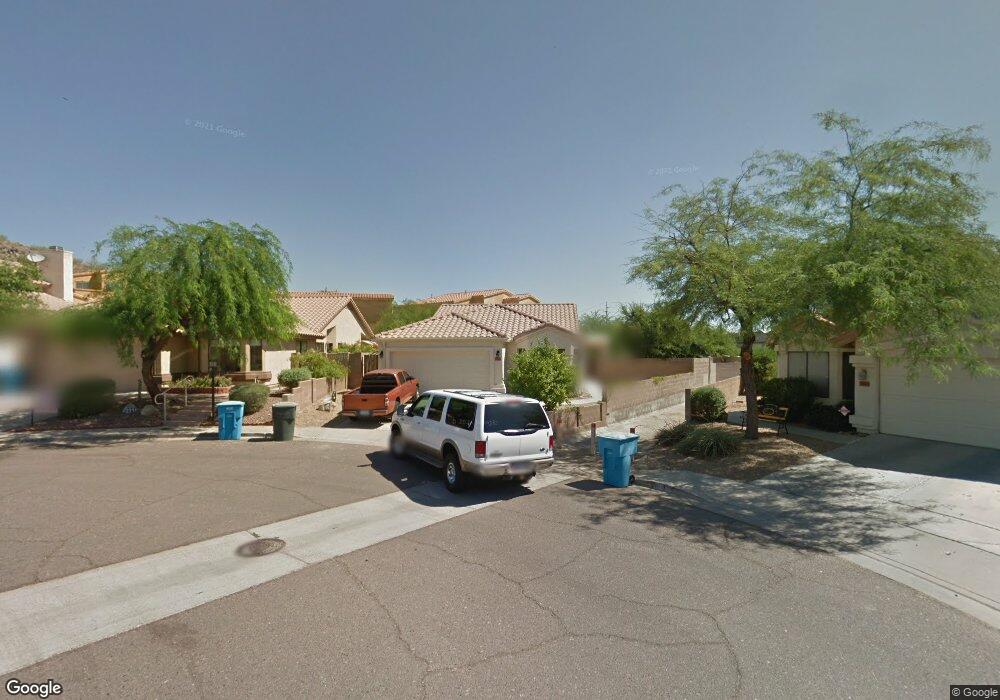
2318 E Topeka (Mtn Preserve) Dr Phoenix, AZ 85024
Paradise Valley Village NeighborhoodEstimated Value: $455,998 - $500,000
3
Beds
2
Baths
1,570
Sq Ft
$303/Sq Ft
Est. Value
About This Home
This home is located at 2318 E Topeka (Mtn Preserve) Dr, Phoenix, AZ 85024 and is currently estimated at $476,000, approximately $303 per square foot. 2318 E Topeka (Mtn Preserve) Dr is a home located in Maricopa County with nearby schools including Sunset Canyon School, Eagle Ridge Elementary School, and Mountain Trail Middle School.
Ownership History
Date
Name
Owned For
Owner Type
Purchase Details
Closed on
Oct 4, 2022
Sold by
Rassam Nada H
Bought by
Lion And Sons For Housing Llc
Current Estimated Value
Purchase Details
Closed on
Jul 5, 2013
Sold by
Rassam Nada H
Bought by
Rassam Nada H and Alkakoz Karam O
Purchase Details
Closed on
May 9, 2013
Sold by
Spofford Carol and Spofford Carol V
Bought by
Rassam Nada H
Purchase Details
Closed on
May 4, 2013
Sold by
Alkakoz Osama and Rassam Nada H
Bought by
Rassam Nada H and Alkakoz Osama
Purchase Details
Closed on
May 2, 2000
Sold by
Galindo Douglas R and Galindo Minerva V
Bought by
Spofford Carol and Spofford Carol
Home Financials for this Owner
Home Financials are based on the most recent Mortgage that was taken out on this home.
Original Mortgage
$133,200
Interest Rate
8.22%
Mortgage Type
New Conventional
Create a Home Valuation Report for This Property
The Home Valuation Report is an in-depth analysis detailing your home's value as well as a comparison with similar homes in the area
Home Values in the Area
Average Home Value in this Area
Purchase History
| Date | Buyer | Sale Price | Title Company |
|---|---|---|---|
| Lion And Sons For Housing Llc | -- | -- | |
| Rassam Nada H | -- | None Available | |
| Rassam Nada H | $175,000 | Chicago Title Agency | |
| Rassam Nada H | -- | Chicago Title Agency Of Alle | |
| Spofford Carol | $148,000 | Security Title Agency |
Source: Public Records
Mortgage History
| Date | Status | Borrower | Loan Amount |
|---|---|---|---|
| Previous Owner | Spofford Carol | $133,200 |
Source: Public Records
Tax History Compared to Growth
Tax History
| Year | Tax Paid | Tax Assessment Tax Assessment Total Assessment is a certain percentage of the fair market value that is determined by local assessors to be the total taxable value of land and additions on the property. | Land | Improvement |
|---|---|---|---|---|
| 2025 | $2,125 | $20,789 | -- | -- |
| 2024 | $2,026 | $19,799 | -- | -- |
| 2023 | $2,026 | $37,550 | $7,510 | $30,040 |
| 2022 | $2,006 | $28,270 | $5,650 | $22,620 |
| 2021 | $2,012 | $25,860 | $5,170 | $20,690 |
| 2020 | $1,949 | $24,420 | $4,880 | $19,540 |
| 2019 | $1,952 | $22,760 | $4,550 | $18,210 |
| 2018 | $1,888 | $20,420 | $4,080 | $16,340 |
| 2017 | $1,810 | $19,400 | $3,880 | $15,520 |
| 2016 | $1,780 | $19,100 | $3,820 | $15,280 |
| 2015 | $1,648 | $16,720 | $3,340 | $13,380 |
Source: Public Records
Map
Nearby Homes
- 19226 N Cave Creek Rd Unit 37
- 19606 N 23rd Way
- 19225 N Cave Creek Rd Unit 99
- 19225 N Cave Creek Rd Unit 46
- 19225 N Cave Creek Rd Unit 83
- 19225 N Cave Creek Rd Unit 70
- 19225 N Cave Creek Rd Unit 44
- 19225 N Cave Creek Rd Unit 52
- 19225 N Cave Creek Rd Unit 65
- 2412 E Rosemonte Dr
- 2510 E Utopia Rd
- 2233 E Behrend Dr Unit 45
- 2233 E Behrend Dr Unit 92
- 2233 E Behrend Dr Unit 8
- 2233 E Behrend Dr Unit 60
- 2233 E Behrend Dr Unit 211
- 2233 E Behrend Dr Unit 29
- 2233 E Behrend Dr Unit 250
- 2233 E Behrend Dr Unit 162
- 2233 E Behrend Dr Unit 17
- 2314 E Topeka Dr
- 19063 N 23rd Place
- 2310 E Topeka Dr
- 19059 N 23rd Place
- 19055 N 23rd Place
- 2302 E Topeka Dr
- 19058 N 23rd Place
- 19051 N 23rd Place
- 19054 N 23rd Place
- 19047 N 23rd Place
- 19050 N 23rd Place
- 2309 E Topeka Dr
- 19043 N 23rd Place
- 2312 E Taro Ln
- 2305 E Topeka Dr
- 2301 E Topeka Dr
- 19039 N 23rd Place
- 2308 E Taro Ln
- 19042 N 24th Place