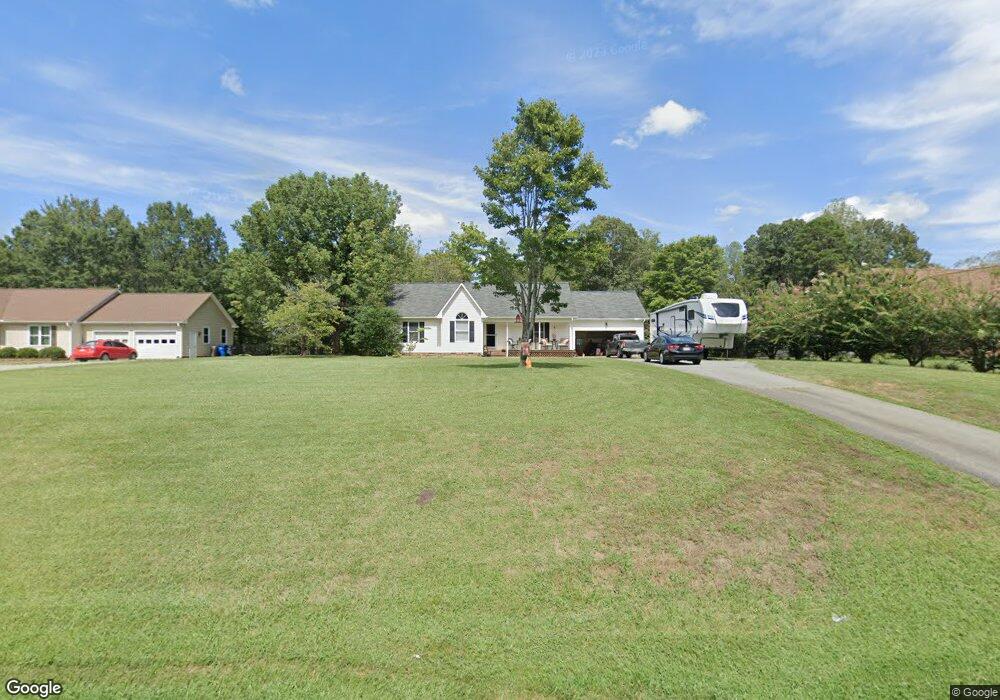
2318 Haw River Hopedale Rd Burlington, NC 27217
Estimated Value: $273,292 - $314,000
3
Beds
2
Baths
1,305
Sq Ft
$225/Sq Ft
Est. Value
About This Home
This home is located at 2318 Haw River Hopedale Rd, Burlington, NC 27217 and is currently estimated at $293,323, approximately $224 per square foot. 2318 Haw River Hopedale Rd is a home located in Alamance County with nearby schools including Haw River Elementary School, Woodlawn Middle School, and Eastern Alamance High School.
Ownership History
Date
Name
Owned For
Owner Type
Purchase Details
Closed on
Oct 9, 2025
Sold by
Enoch Casey L and Cook Joey L
Bought by
Mac & Gray Properties Llc
Current Estimated Value
Home Financials for this Owner
Home Financials are based on the most recent Mortgage that was taken out on this home.
Original Mortgage
$100,000
Outstanding Balance
$100,000
Interest Rate
6.56%
Mortgage Type
Credit Line Revolving
Estimated Equity
$193,323
Purchase Details
Closed on
Aug 21, 2009
Sold by
Williams Alicia Dawn
Bought by
Enoch Casey L
Home Financials for this Owner
Home Financials are based on the most recent Mortgage that was taken out on this home.
Original Mortgage
$136,294
Interest Rate
5.19%
Mortgage Type
FHA
Purchase Details
Closed on
Feb 22, 2000
Sold by
Lewis Barry Edward
Bought by
Williams Alicia Dawn
Home Financials for this Owner
Home Financials are based on the most recent Mortgage that was taken out on this home.
Original Mortgage
$93,500
Interest Rate
8.29%
Create a Home Valuation Report for This Property
The Home Valuation Report is an in-depth analysis detailing your home's value as well as a comparison with similar homes in the area
Home Values in the Area
Average Home Value in this Area
Purchase History
| Date | Buyer | Sale Price | Title Company |
|---|---|---|---|
| Mac & Gray Properties Llc | -- | None Listed On Document | |
| Enoch Casey L | $141,000 | -- | |
| Williams Alicia Dawn | $165,000 | -- |
Source: Public Records
Mortgage History
| Date | Status | Borrower | Loan Amount |
|---|---|---|---|
| Open | Mac & Gray Properties Llc | $100,000 | |
| Previous Owner | Enoch Casey L | $136,294 | |
| Previous Owner | Williams Alicia Dawn | $93,500 |
Source: Public Records
Tax History Compared to Growth
Tax History
| Year | Tax Paid | Tax Assessment Tax Assessment Total Assessment is a certain percentage of the fair market value that is determined by local assessors to be the total taxable value of land and additions on the property. | Land | Improvement |
|---|---|---|---|---|
| 2025 | $2,453 | $262,622 | $37,338 | $225,284 |
| 2024 | $2,387 | $262,622 | $37,338 | $225,284 |
| 2023 | $2,279 | $262,622 | $37,338 | $225,284 |
| 2022 | $1,704 | $133,821 | $24,447 | $109,374 |
| 2021 | $1,718 | $133,821 | $24,447 | $109,374 |
| 2020 | $1,731 | $133,821 | $24,447 | $109,374 |
| 2019 | $1,539 | $133,821 | $24,447 | $109,374 |
| 2018 | $0 | $133,821 | $24,447 | $109,374 |
| 2017 | $1,419 | $133,821 | $24,447 | $109,374 |
| 2016 | $1,489 | $140,490 | $26,670 | $113,820 |
| 2015 | $1,501 | $142,277 | $26,670 | $115,607 |
| 2014 | $1,430 | $142,277 | $26,670 | $115,607 |
Source: Public Records
Map
Nearby Homes
- 378 Boundary St
- Vl Highway 70 E
- 780 Indian Village Trail
- 523 E Main St
- 0 State Highway 49
- 704 Rolling Rd
- 403 Rolling Rd
- 201 Oakwood Dr
- 720 Roxboro St
- 325 Chris St
- 131 N Wilkins Rd
- 639 Woodhaven Dr
- 119 S Spray St
- 1034 Apple Blossom Ln
- 2319 James Boswell Rd
- 635 Black Angus Dr
- 460 Fran Dr
- 462 Fran Dr
- 464 Fran Dr
- 468 Fran Dr
- 2314 Haw River Hopedale Rd
- 2322 Haw River Hopedale Rd
- 2310 Haw River Hopedale Rd
- 2326 Haw River Hopedale Rd
- 2341 Haw River Hopedale Rd
- 2268 Haw River Hopedale Rd
- 2264 Haw River Hopedale Rd
- 2264 Haw River Hopedale Rd
- 2349 Haw River Hopedale Rd
- 2344 Haw River Hopedale Rd
- 2371 Haw River Hopedale Rd
- 2262 Haw River Hopedale Rd
- 2347 Haw River Hopedale R
- 2258 Haw River Hopedale Rd
- 2422 Haw River Hopedale Rd
- 2238 Haw River Hopedale Rd
- 2434 Haw River Hopedale Rd
- 2240 Haw River Hopedale Rd
- 2471 Haw River Hopedale Rd
- 2160 Haw River Hopedale Rd