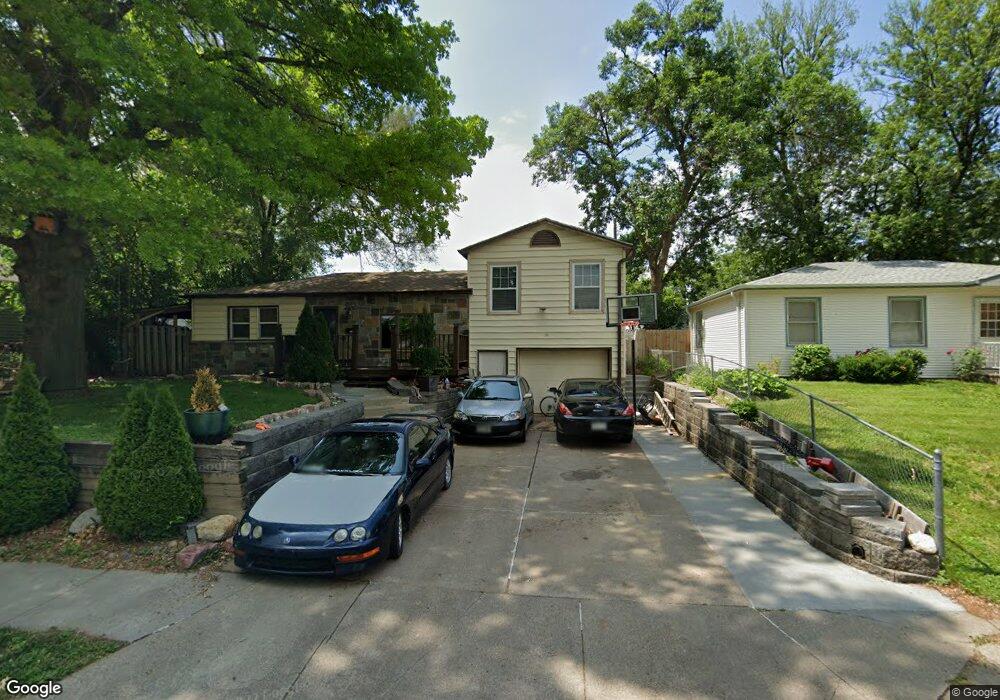
2318 Olive St Bellevue, NE 68147
Estimated Value: $231,000 - $348,000
3
Beds
4
Baths
1,725
Sq Ft
$156/Sq Ft
Est. Value
About This Home
This home is located at 2318 Olive St, Bellevue, NE 68147 and is currently estimated at $269,042, approximately $155 per square foot. 2318 Olive St is a home located in Sarpy County with nearby schools including Chandler View Elementary School, Bryan Middle School, and Bryan High School.
Ownership History
Date
Name
Owned For
Owner Type
Purchase Details
Closed on
Jun 24, 2025
Sold by
Varela Jose A and Rios Juana E
Bought by
Varela-Rios Natalie
Current Estimated Value
Purchase Details
Closed on
Dec 5, 2001
Sold by
Recoy Richard L and Recoy Joy J
Bought by
Varela Jose A and Rios Juana E
Home Financials for this Owner
Home Financials are based on the most recent Mortgage that was taken out on this home.
Original Mortgage
$99,100
Interest Rate
6.52%
Mortgage Type
FHA
Purchase Details
Closed on
Oct 7, 1998
Sold by
Henriksen Brenda J and Henriksen Gregory A
Bought by
Recoy Richard L and Enderle Joy
Home Financials for this Owner
Home Financials are based on the most recent Mortgage that was taken out on this home.
Original Mortgage
$83,750
Interest Rate
6.73%
Mortgage Type
FHA
Create a Home Valuation Report for This Property
The Home Valuation Report is an in-depth analysis detailing your home's value as well as a comparison with similar homes in the area
Home Values in the Area
Average Home Value in this Area
Purchase History
| Date | Buyer | Sale Price | Title Company |
|---|---|---|---|
| Varela-Rios Natalie | -- | Cornhusker Land Title | |
| Varela Jose A | $100,000 | -- | |
| Recoy Richard L | $85,000 | -- |
Source: Public Records
Mortgage History
| Date | Status | Borrower | Loan Amount |
|---|---|---|---|
| Previous Owner | Varela Jose A | $99,100 | |
| Previous Owner | Recoy Richard L | $83,750 |
Source: Public Records
Tax History
| Year | Tax Paid | Tax Assessment Tax Assessment Total Assessment is a certain percentage of the fair market value that is determined by local assessors to be the total taxable value of land and additions on the property. | Land | Improvement |
|---|---|---|---|---|
| 2025 | $3,751 | $237,383 | $30,000 | $207,383 |
| 2024 | $4,464 | $222,249 | $25,000 | $197,249 |
| 2023 | $4,464 | $206,793 | $25,000 | $181,793 |
| 2022 | $4,264 | $195,298 | $25,000 | $170,298 |
| 2021 | $4,078 | $185,625 | $20,000 | $165,625 |
| 2020 | $3,691 | $166,894 | $20,000 | $146,894 |
| 2019 | $3,437 | $155,117 | $17,000 | $138,117 |
| 2018 | $3,205 | $143,575 | $17,000 | $126,575 |
| 2017 | $3,054 | $136,172 | $17,000 | $119,172 |
| 2016 | $2,811 | $126,221 | $17,000 | $109,221 |
| 2015 | $2,639 | $119,444 | $17,000 | $102,444 |
| 2014 | $2,514 | $114,699 | $17,000 | $97,699 |
| 2012 | -- | $108,253 | $17,000 | $91,253 |
Source: Public Records
Map
Nearby Homes
- 2333 Olive St
- 7514 Chandler Hills Dr
- 7208 Chandler Hills Dr
- 7005 Chandler Hills Dr
- 7415 S 20th St
- 2529 Mose Ave Unit 9A
- 2146 Polk St
- 2705 Emiline St
- 2805 Lillian St
- 2822 Josephine St
- 2513 Cornelia St
- 1504 Harrison St
- 2816 Monroe St
- 3002 Columbus Ave
- 2623 Z St
- 2516 Chandler Rd E
- 2605 Virginia St
- 8688 S 23rd St
- 2206 Citta Cir
- 1328 Washington St
- 2314 Olive St
- 2322 Olive St
- 2313 Josephine St
- 2307 Josephine St
- 2330 Olive St
- 7308 Chandler Hills Dr
- 2315 Josephine St
- 2321 Olive St
- 2325 Olive St
- 2317 Olive St
- 7304 Chandler Hills Dr
- 2329 Olive St
- 2334 Olive St
- 7402 Chandler Hills Dr
- 2319 Josephine St
- 2210 Lillian St
- 7309 S 24th Ave
- 2312 Josephine St
- 2206 Lillian St
- 2214 Lillian St
Your Personal Tour Guide
Ask me questions while you tour the home.