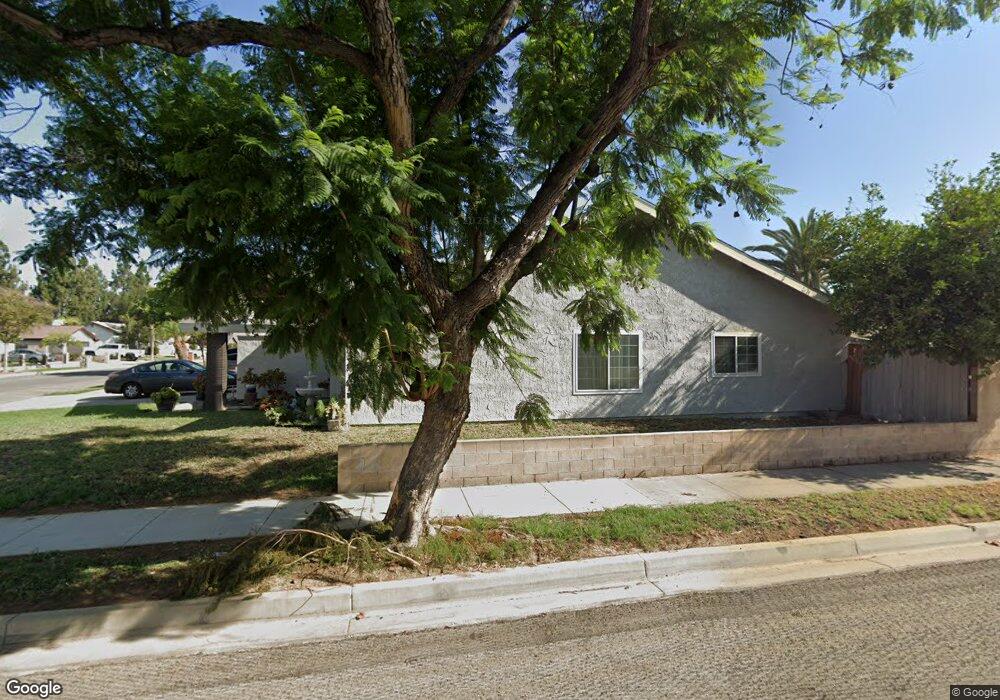
2319 S Phoenix Ave Ontario, CA 91761
Downtown Ontario NeighborhoodEstimated Value: $687,000 - $743,000
4
Beds
2
Baths
1,645
Sq Ft
$429/Sq Ft
Est. Value
About This Home
This home is located at 2319 S Phoenix Ave, Ontario, CA 91761 and is currently estimated at $705,620, approximately $428 per square foot. 2319 S Phoenix Ave is a home located in San Bernardino County with nearby schools including Bon View Elementary, De Anza Middle, and Ontario High School.
Ownership History
Date
Name
Owned For
Owner Type
Purchase Details
Closed on
May 3, 2016
Sold by
Tejada Karina
Bought by
Tejada Jose L and Tejada Elba
Current Estimated Value
Purchase Details
Closed on
Oct 13, 1997
Sold by
Delrosario Renato T and Delrosario Anelle
Bought by
Tejada Jose L and Tejada Elba
Home Financials for this Owner
Home Financials are based on the most recent Mortgage that was taken out on this home.
Original Mortgage
$139,008
Interest Rate
7.3%
Mortgage Type
FHA
Purchase Details
Closed on
Mar 9, 1995
Sold by
Ringer Brenda
Bought by
Delrosario Renato T and Delrosario Anelle
Home Financials for this Owner
Home Financials are based on the most recent Mortgage that was taken out on this home.
Original Mortgage
$100,000
Interest Rate
8.51%
Purchase Details
Closed on
Oct 20, 1994
Sold by
Ringer Andrew J
Bought by
Ringer Brenda
Create a Home Valuation Report for This Property
The Home Valuation Report is an in-depth analysis detailing your home's value as well as a comparison with similar homes in the area
Home Values in the Area
Average Home Value in this Area
Purchase History
| Date | Buyer | Sale Price | Title Company |
|---|---|---|---|
| Tejada Jose L | -- | None Available | |
| Tejada Jose L | $141,000 | Fidelity National Title Ins | |
| Delrosario Renato T | $125,000 | World Title Company | |
| Ringer Brenda | -- | -- |
Source: Public Records
Mortgage History
| Date | Status | Borrower | Loan Amount |
|---|---|---|---|
| Previous Owner | Tejada Jose L | $139,008 | |
| Previous Owner | Delrosario Renato T | $100,000 | |
| Closed | Delrosario Renato T | $18,750 |
Source: Public Records
Tax History Compared to Growth
Tax History
| Year | Tax Paid | Tax Assessment Tax Assessment Total Assessment is a certain percentage of the fair market value that is determined by local assessors to be the total taxable value of land and additions on the property. | Land | Improvement |
|---|---|---|---|---|
| 2025 | $2,403 | $225,147 | $65,468 | $159,679 |
| 2024 | $2,403 | $220,732 | $64,184 | $156,548 |
| 2023 | $2,336 | $216,403 | $62,925 | $153,478 |
| 2022 | $2,305 | $212,160 | $61,691 | $150,469 |
| 2021 | $2,289 | $208,000 | $60,481 | $147,519 |
| 2020 | $2,249 | $205,867 | $59,861 | $146,006 |
| 2019 | $2,229 | $201,830 | $58,687 | $143,143 |
| 2018 | $2,198 | $214,417 | $64,274 | $150,143 |
| 2017 | $2,297 | $210,213 | $63,014 | $147,199 |
| 2016 | $2,036 | $190,184 | $55,302 | $134,882 |
| 2015 | $2,022 | $187,327 | $54,471 | $132,856 |
| 2014 | $1,960 | $183,658 | $53,404 | $130,254 |
Source: Public Records
Map
Nearby Homes
- 2408 S Taylor Place
- 2119 S Phoenix Place
- 513 E Fairfield Ct
- 2300 S Sultana Ave Unit 298
- 4235 S Gasly Paseo
- 0 Vineyard Unit CV25067044
- 4245 S Grasly Paseo
- 4233 S Grasly Paseo
- 0 Phillips Unit CV23180894
- 2148 S Sultana Ave
- 310 E Philadelphia St Unit 35
- 310 E Philadelphia St
- 2001 S Campus Ave Unit 7F
- 2030 S Bon View Ave Unit G
- 2437 S Garfield Place
- 840 E Cedar St
- 304 E Cedar St
- 1020 E Tam o Shanter Ct
- 2343 S Via Veranda Unit 10
- 2453 S Marigold Place
- 2313 S Phoenix Ave
- 2320 S Caldwell Ave
- 2307 S Phoenix Ave
- 2314 S Caldwell Ave
- 726 E Skylark St
- 720 E Skylark St
- 3206 Painted Crescent St E
- 42829 S Glacier Trail
- 0 Call for Info Unit CC61001
- 0 Cypress Ave Unit C09095847
- 6 Street
- 6 Th St
- 1368 -1388 W Mission Blvd Unit Address: 1388 W. Mis
- 99999 Euclid
- 2573 E Wyandotte Ct
- 2527 E Murdock Ln
- 1520 Bldg. E N Mountain Unit 206
- 1520 Bldg. E N Mountain Unit 200
- 2308 S Caldwell Ave
- 732 E Skylark St