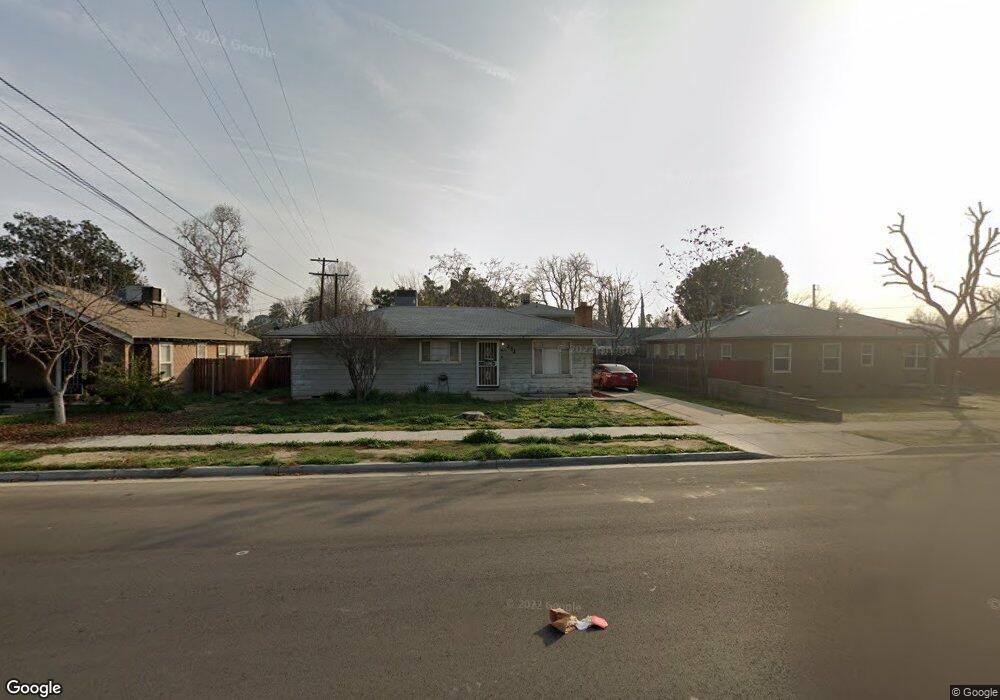
232 1/2 Holtby Rd Bakersfield, CA 93304
Oleander-Sunset NeighborhoodEstimated Value: $196,000 - $311,000
4
Beds
1
Bath
1,270
Sq Ft
$219/Sq Ft
Est. Value
About This Home
This home is located at 232 1/2 Holtby Rd, Bakersfield, CA 93304 and is currently estimated at $277,979, approximately $218 per square foot. 232 1/2 Holtby Rd is a home located in Kern County with nearby schools including Roosevelt Elementary School, Emerson Middle School, and Bakersfield High School.
Ownership History
Date
Name
Owned For
Owner Type
Purchase Details
Closed on
May 6, 2025
Sold by
Alamillo Valerie Diane
Bought by
Alamillo Luis
Current Estimated Value
Home Financials for this Owner
Home Financials are based on the most recent Mortgage that was taken out on this home.
Original Mortgage
$229,650
Outstanding Balance
$228,631
Interest Rate
6.65%
Mortgage Type
New Conventional
Estimated Equity
$49,348
Purchase Details
Closed on
Mar 31, 2025
Sold by
Sbe Lp
Bought by
Alamillo Luis
Home Financials for this Owner
Home Financials are based on the most recent Mortgage that was taken out on this home.
Original Mortgage
$229,650
Outstanding Balance
$228,631
Interest Rate
6.65%
Mortgage Type
New Conventional
Estimated Equity
$49,348
Purchase Details
Closed on
Dec 12, 2024
Sold by
Johnson Harolyn L
Bought by
Sbe Lp
Create a Home Valuation Report for This Property
The Home Valuation Report is an in-depth analysis detailing your home's value as well as a comparison with similar homes in the area
Home Values in the Area
Average Home Value in this Area
Purchase History
| Date | Buyer | Sale Price | Title Company |
|---|---|---|---|
| Alamillo Luis | -- | Chicago Title Company | |
| Alamillo Luis | $306,500 | Chicago Title Company | |
| Sbe Lp | $200,000 | Chicago Title |
Source: Public Records
Mortgage History
| Date | Status | Borrower | Loan Amount |
|---|---|---|---|
| Open | Alamillo Luis | $229,650 |
Source: Public Records
Tax History Compared to Growth
Tax History
| Year | Tax Paid | Tax Assessment Tax Assessment Total Assessment is a certain percentage of the fair market value that is determined by local assessors to be the total taxable value of land and additions on the property. | Land | Improvement |
|---|---|---|---|---|
| 2025 | $4,079 | $152,344 | $26,095 | $126,249 |
| 2024 | $4,079 | $149,358 | $25,584 | $123,774 |
| 2023 | $2,921 | $146,431 | $25,083 | $121,348 |
| 2022 | $2,832 | $143,561 | $24,592 | $118,969 |
| 2021 | $2,642 | $140,747 | $24,110 | $116,637 |
| 2020 | $2,575 | $139,305 | $23,863 | $115,442 |
| 2019 | $2,525 | $139,305 | $23,863 | $115,442 |
| 2018 | $2,472 | $133,898 | $22,938 | $110,960 |
| 2017 | $2,454 | $131,274 | $22,489 | $108,785 |
| 2016 | $2,283 | $128,701 | $22,049 | $106,652 |
Source: Public Records
Map
Nearby Homes