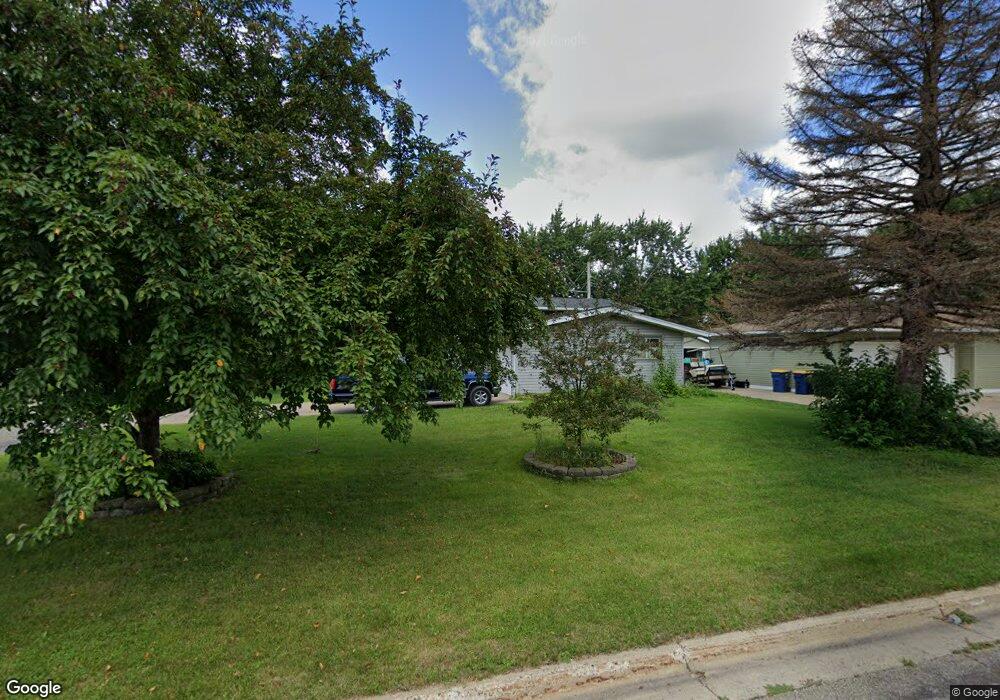
232 232 22nd-Avenue-sw Faribault, MN 55021
Estimated Value: $279,971 - $311,000
3
Beds
2
Baths
1,119
Sq Ft
$262/Sq Ft
Est. Value
About This Home
This home is located at 232 232 22nd-Avenue-sw, Faribault, MN 55021 and is currently estimated at $293,243, approximately $262 per square foot. 232 232 22nd-Avenue-sw is a home located in Rice County with nearby schools including Jefferson Elementary School, Faribault Middle School, and Faribault Senior High School.
Ownership History
Date
Name
Owned For
Owner Type
Purchase Details
Closed on
Aug 5, 2015
Sold by
Tuma Michael Michael
Bought by
Remillard Terry Terry
Current Estimated Value
Home Financials for this Owner
Home Financials are based on the most recent Mortgage that was taken out on this home.
Original Mortgage
$121,000
Outstanding Balance
$95,004
Interest Rate
3.98%
Estimated Equity
$198,239
Purchase Details
Closed on
Apr 15, 2008
Sold by
Waak Jon E
Bought by
Tuma Michael E
Purchase Details
Closed on
Dec 7, 2005
Sold by
Dull Kristine
Bought by
Waak Jon E
Purchase Details
Closed on
Apr 26, 2001
Sold by
Schaffran Jamie R and Schaffran Cheryl G
Bought by
Richardson Jonathan and Dull Kristine
Purchase Details
Closed on
Aug 29, 1997
Bought by
Schaffran Jamie R and Linse Cheryl G
Create a Home Valuation Report for This Property
The Home Valuation Report is an in-depth analysis detailing your home's value as well as a comparison with similar homes in the area
Home Values in the Area
Average Home Value in this Area
Purchase History
| Date | Buyer | Sale Price | Title Company |
|---|---|---|---|
| Remillard Terry Terry | $134,000 | -- | |
| Tuma Michael E | $142,000 | -- | |
| Waak Jon E | $152,500 | -- | |
| Richardson Jonathan | $116,700 | -- | |
| Schaffran Jamie R | $79,900 | -- |
Source: Public Records
Mortgage History
| Date | Status | Borrower | Loan Amount |
|---|---|---|---|
| Open | Remillard Terry Terry | $121,000 |
Source: Public Records
Tax History Compared to Growth
Tax History
| Year | Tax Paid | Tax Assessment Tax Assessment Total Assessment is a certain percentage of the fair market value that is determined by local assessors to be the total taxable value of land and additions on the property. | Land | Improvement |
|---|---|---|---|---|
| 2025 | $2,804 | $258,500 | $51,400 | $207,100 |
| 2024 | $2,804 | $254,500 | $46,400 | $208,100 |
| 2023 | $2,728 | $254,500 | $46,400 | $208,100 |
| 2022 | $2,372 | $236,100 | $43,100 | $193,000 |
| 2021 | $2,178 | $196,700 | $33,100 | $163,600 |
| 2020 | $2,104 | $182,100 | $29,800 | $152,300 |
| 2019 | $1,844 | $179,600 | $28,200 | $151,400 |
| 2018 | $1,652 | $159,200 | $26,500 | $132,700 |
| 2017 | $1,666 | $142,400 | $26,500 | $115,900 |
| 2016 | $1,684 | $139,700 | $26,500 | $113,200 |
| 2015 | $1,388 | $138,300 | $26,500 | $111,800 |
| 2014 | -- | $123,200 | $26,500 | $96,700 |
Source: Public Records
Map
Nearby Homes
- 21126 Bagley Ave
- 1825 Ladonna Ln
- 517 Ladonna Ln
- 412 Prairie Ave SW
- 38 Prairie Ave SW
- 1050 Westwood Dr
- 1425 4th St NW
- 1032 Valley View Rd
- 1744 6th St NW
- 1503 Highland Place
- 13 Mitchell Dr
- 207 9th Ave SW
- 1118 Home Place
- 1900 Hiersche Rd
- 2130 198th St W
- 1304 Prairie Ave SW
- 835 Carlton Ave
- 725 2nd St NW
- 716 1st St NW
- 1039 9th Ave SW
- 232 22nd Ave SW
- 224 22nd Ave SW
- 234 22nd Ave SW
- 236 22nd Ave SW
- 238 22nd Ave SW
- 214 22nd Ave SW
- 227 22nd Ave SW
- 231 22nd Ave SW
- 206 22nd Ave SW
- 405 Western Ave SW
- 213 22nd Ave SW
- 205 22nd Ave SW
- 142 22nd Ave SW
- 139 22nd Ave SW
- 317 Western Ave SW
- 130 22nd Ave SW
- 129 22nd Ave SW
- 430 Western Ave SW
- 121 22nd Ave SW
- 122 22nd Ave SW