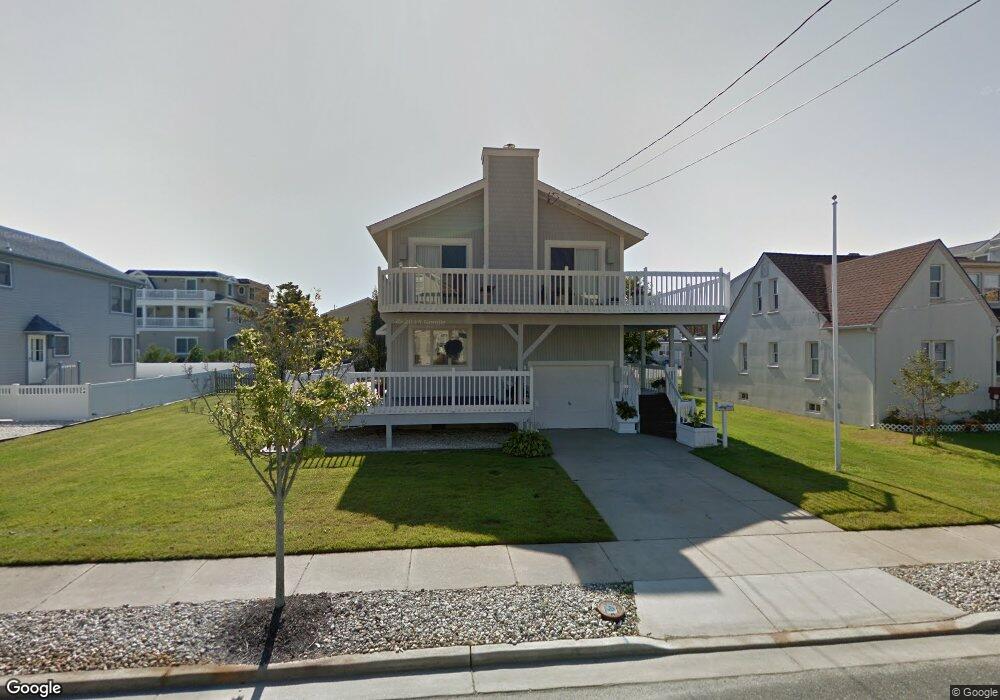
232 57th St Avalon, NJ 08202
Estimated Value: $2,941,098 - $5,222,000
Studio
--
Bath
2,172
Sq Ft
$1,721/Sq Ft
Est. Value
About This Home
This home is located at 232 57th St, Avalon, NJ 08202 and is currently estimated at $3,738,025, approximately $1,721 per square foot. 232 57th St is a home located in Cape May County with nearby schools including Avalon Elementary School.
Ownership History
Date
Name
Owned For
Owner Type
Purchase Details
Closed on
Nov 6, 2020
Sold by
Mulrine Beverly A and Mulrine James A
Bought by
Mulrine Beverly A
Current Estimated Value
Home Financials for this Owner
Home Financials are based on the most recent Mortgage that was taken out on this home.
Original Mortgage
$260,000
Interest Rate
2.8%
Mortgage Type
Stand Alone Refi Refinance Of Original Loan
Purchase Details
Closed on
Nov 14, 1997
Sold by
Mcfadden Joseph R
Bought by
Mulrine James H and Mulrine Beverly A
Home Financials for this Owner
Home Financials are based on the most recent Mortgage that was taken out on this home.
Original Mortgage
$300,000
Interest Rate
7.17%
Create a Home Valuation Report for This Property
The Home Valuation Report is an in-depth analysis detailing your home's value as well as a comparison with similar homes in the area
Home Values in the Area
Average Home Value in this Area
Purchase History
| Date | Buyer | Sale Price | Title Company |
|---|---|---|---|
| Mulrine Beverly A | -- | None Available | |
| Mulrine Beverly A | -- | None Available | |
| Mulrine James H | $489,000 | -- |
Source: Public Records
Mortgage History
| Date | Status | Borrower | Loan Amount |
|---|---|---|---|
| Previous Owner | Mulrine Beverly A | $260,000 | |
| Previous Owner | Mulrine James H | $300,000 |
Source: Public Records
Tax History
| Year | Tax Paid | Tax Assessment Tax Assessment Total Assessment is a certain percentage of the fair market value that is determined by local assessors to be the total taxable value of land and additions on the property. | Land | Improvement |
|---|---|---|---|---|
| 2025 | $8,850 | $1,441,300 | $1,083,300 | $358,000 |
| 2024 | $8,850 | $1,441,300 | $1,083,300 | $358,000 |
| 2023 | $8,778 | $1,441,300 | $1,083,300 | $358,000 |
| 2022 | $8,187 | $1,441,300 | $1,083,300 | $358,000 |
| 2021 | $2,371 | $1,441,300 | $1,083,300 | $358,000 |
| 2020 | $7,581 | $1,441,300 | $1,083,300 | $358,000 |
| 2019 | $7,351 | $1,441,300 | $1,083,300 | $358,000 |
| 2018 | $7,034 | $1,441,300 | $1,083,300 | $358,000 |
| 2017 | $6,785 | $1,220,400 | $866,600 | $353,800 |
| 2016 | $6,712 | $1,220,400 | $866,600 | $353,800 |
| 2015 | $6,602 | $1,220,400 | $866,600 | $353,800 |
| 2014 | $6,529 | $1,220,400 | $866,600 | $353,800 |
Source: Public Records
Map
Nearby Homes
- 5765 Ocean Dr
- 5499 Dune Dr
- 6229 Dune Dr
- 150 64th St
- 4640 Ocean Dr
- 4610 4th Ave
- 6762 Ocean Dr Unit 6762
- 6772 Ocean Dr Unit 6772
- 177 71st St
- 256 42nd St
- 264 41st St
- 4040 Dune Dr
- 198 40th St
- 360 39th St Unit East
- 7463 Ocean Dr
- 7800 Dune Dr Unit C205
- 315 79th St Unit 315
- 253 35th St Unit WEST
- 7888 Dune Dr Unit 218
- 3429 Dune Dr
Your Personal Tour Guide
Ask me questions while you tour the home.