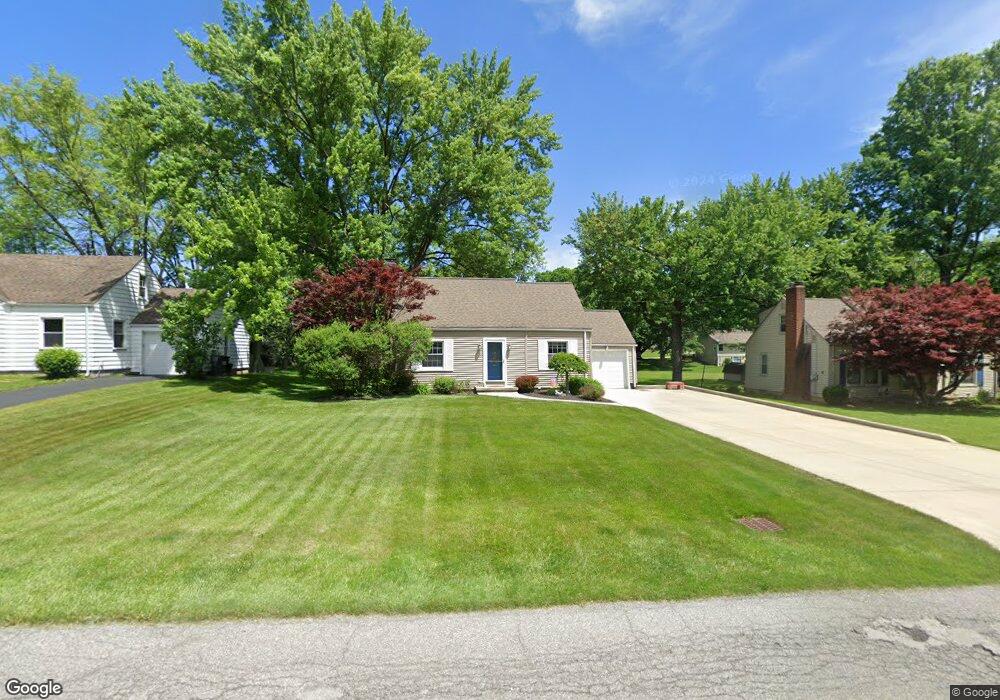
232 Callahan Rd Canfield, OH 44406
Estimated Value: $189,000 - $222,000
3
Beds
1
Bath
1,119
Sq Ft
$181/Sq Ft
Est. Value
About This Home
This home is located at 232 Callahan Rd, Canfield, OH 44406 and is currently estimated at $202,420, approximately $180 per square foot. 232 Callahan Rd is a home located in Mahoning County with nearby schools including Canfield Village Middle School, Canfield High School, and St Charles Elementary School.
Ownership History
Date
Name
Owned For
Owner Type
Purchase Details
Closed on
Mar 28, 2024
Sold by
Saylor Alison R and Loree Alison R
Bought by
Loree Alison R and Loree Donald C
Current Estimated Value
Purchase Details
Closed on
Mar 28, 2004
Sold by
Hura Richard J and Hura Alexis M
Bought by
Saylor Alison R
Home Financials for this Owner
Home Financials are based on the most recent Mortgage that was taken out on this home.
Original Mortgage
$90,590
Interest Rate
5.65%
Mortgage Type
FHA
Purchase Details
Closed on
Apr 21, 2000
Sold by
Seaman Richard L and Seaman Edna L
Bought by
Hura Richard J and Hura Alexis M
Purchase Details
Closed on
Nov 5, 1984
Bought by
Seaman Richard L and E L
Create a Home Valuation Report for This Property
The Home Valuation Report is an in-depth analysis detailing your home's value as well as a comparison with similar homes in the area
Home Values in the Area
Average Home Value in this Area
Purchase History
| Date | Buyer | Sale Price | Title Company |
|---|---|---|---|
| Loree Alison R | -- | None Listed On Document | |
| Saylor Alison R | $92,000 | -- | |
| Hura Richard J | $81,000 | -- | |
| Seaman Richard L | -- | -- |
Source: Public Records
Mortgage History
| Date | Status | Borrower | Loan Amount |
|---|---|---|---|
| Previous Owner | Saylor Alison R | $90,590 |
Source: Public Records
Tax History
| Year | Tax Paid | Tax Assessment Tax Assessment Total Assessment is a certain percentage of the fair market value that is determined by local assessors to be the total taxable value of land and additions on the property. | Land | Improvement |
|---|---|---|---|---|
| 2025 | $2,151 | $49,890 | $9,590 | $40,300 |
| 2024 | $2,152 | $49,890 | $9,590 | $40,300 |
| 2023 | $2,117 | $49,890 | $9,590 | $40,300 |
| 2022 | $1,820 | $34,110 | $9,140 | $24,970 |
| 2021 | $1,766 | $34,110 | $9,140 | $24,970 |
| 2020 | $1,773 | $34,110 | $9,140 | $24,970 |
| 2019 | $1,814 | $31,640 | $9,140 | $22,500 |
| 2018 | $1,791 | $31,640 | $9,140 | $22,500 |
| 2017 | $1,788 | $31,640 | $9,140 | $22,500 |
| 2016 | $1,695 | $30,550 | $6,670 | $23,880 |
| 2015 | $1,658 | $30,550 | $6,670 | $23,880 |
| 2014 | $1,665 | $30,550 | $6,670 | $23,880 |
| 2013 | $1,605 | $30,550 | $6,670 | $23,880 |
Source: Public Records
Map
Nearby Homes
- 71 Hilltop Blvd
- 36 Hilltop Blvd
- 223 Fairview Ave
- 30 Newton Square Dr Unit 3
- 30 Newton Square Dr Unit 1
- 120 Talsman Dr Unit 4
- 361 Hilltop Blvd Unit 1A
- 124 Wadsworth St
- 9 Willow Way
- 315 W Main St
- 21 Villa Theresa Ln
- 31 Villa Theresa Ln
- 10 Villa Theresa Ln
- 41 Villa Theresa Ln
- 51 Villa Theresa Ln
- 61 Villa Theresa Ln
- 20 Villa Theresa Ln
- 71 Villa Theresa Ln
- 30 Villa Theresa Ln
- 81 Villa Theresa Ln
- 240 Callahan Rd
- 224 Callahan Rd
- 248 Callahan Rd
- 218 Callahan Rd
- 223 Callahan Rd
- 210 Callahan Rd
- 258 Callahan Rd
- 157 Neff Dr
- 231 Callahan Rd
- 237 Callahan Rd
- 217 Callahan Rd
- 245 Callahan Rd
- 225 Neff Dr
- 209 Callahan Rd
- 188 Callahan Rd
- 147 Neff Dr
- 1025 Village Blvd
- 251 Callahan Rd
- 203 Callahan Rd
- 300 Callahan Rd
Your Personal Tour Guide
Ask me questions while you tour the home.