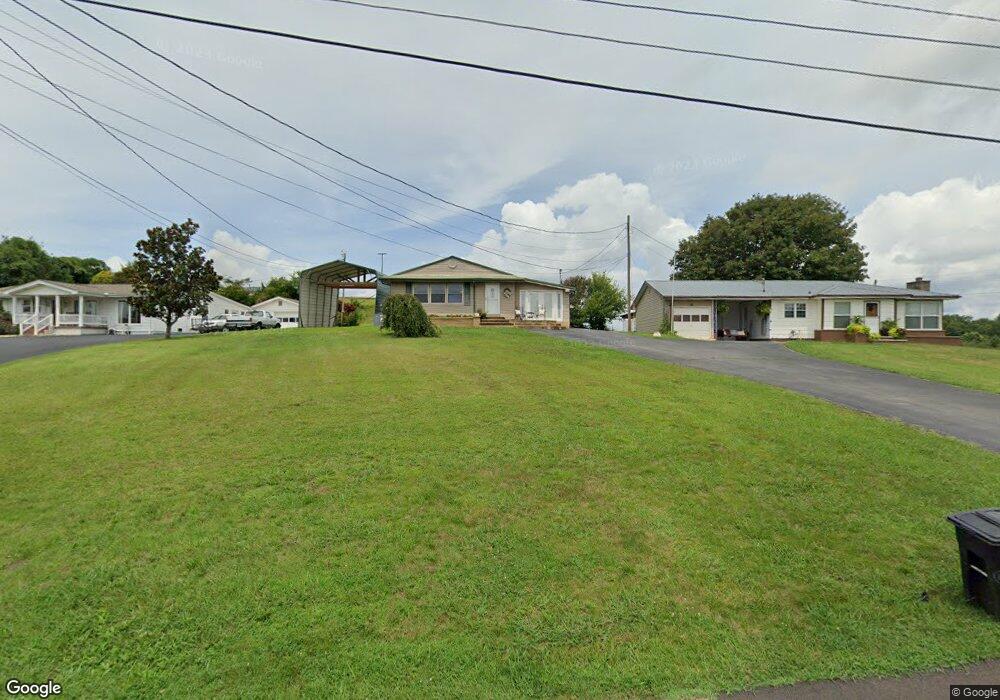
232 Charles St Newport, TN 37821
Estimated Value: $141,000 - $190,000
--
Bed
2
Baths
1,300
Sq Ft
$128/Sq Ft
Est. Value
About This Home
This home is located at 232 Charles St, Newport, TN 37821 and is currently estimated at $166,781, approximately $128 per square foot. 232 Charles St is a home located in Cocke County with nearby schools including Newport Grammar School, Calvary Baptist Tabernacle School, and Grace Christian School.
Ownership History
Date
Name
Owned For
Owner Type
Purchase Details
Closed on
Oct 1, 2025
Sold by
Smith Christy Lawson and Williams Christy Lawson
Bought by
Lawson Gwendia D
Current Estimated Value
Purchase Details
Closed on
Apr 10, 2024
Sold by
Williams Eric
Bought by
Williams Christy Anne
Purchase Details
Closed on
Sep 16, 2022
Sold by
Williams Eric
Bought by
Williams Christy Lawson
Purchase Details
Closed on
Jan 17, 2019
Sold by
Bryant Clifford Lee
Bought by
Williams Eric and Williams Christy Anne
Purchase Details
Closed on
Aug 10, 2018
Sold by
Lawson Christy Ann
Bought by
Williams Lawson and Williams Eric
Purchase Details
Closed on
Jan 22, 2008
Sold by
Francis Donald F
Bought by
Lawson Christy Ann
Purchase Details
Closed on
Nov 11, 1995
Bought by
Francis Donald F and Francis Tammy M
Create a Home Valuation Report for This Property
The Home Valuation Report is an in-depth analysis detailing your home's value as well as a comparison with similar homes in the area
Home Values in the Area
Average Home Value in this Area
Purchase History
| Date | Buyer | Sale Price | Title Company |
|---|---|---|---|
| Williams Christy Anne | -- | None Listed On Document | |
| Williams Christy Anne | -- | None Listed On Document | |
| Williams Christy Lawson | -- | None Listed On Document | |
| Williams Christy Lawson | -- | None Listed On Document | |
| Williams Eric | $55,000 | None Listed On Document | |
| Williams Lawson | -- | None Available | |
| Lawson Christy Ann | -- | -- | |
| Francis Donald F | $35,000 | -- |
Source: Public Records
Tax History Compared to Growth
Tax History
| Year | Tax Paid | Tax Assessment Tax Assessment Total Assessment is a certain percentage of the fair market value that is determined by local assessors to be the total taxable value of land and additions on the property. | Land | Improvement |
|---|---|---|---|---|
| 2024 | $1,222 | $24,575 | $4,625 | $19,950 |
| 2023 | $1,222 | $24,575 | $4,625 | $19,950 |
| 2022 | $1,223 | $24,575 | $4,625 | $19,950 |
| 2021 | $1,223 | $24,575 | $4,625 | $19,950 |
| 2020 | $0 | $24,575 | $4,625 | $19,950 |
| 2019 | $1,199 | $21,925 | $4,625 | $17,300 |
| 2018 | $1,199 | $21,925 | $4,625 | $17,300 |
| 2017 | $1,269 | $21,925 | $4,625 | $17,300 |
| 2016 | $1,200 | $21,925 | $4,625 | $17,300 |
| 2015 | $949 | $21,925 | $4,625 | $17,300 |
| 2014 | $949 | $21,925 | $4,625 | $17,300 |
| 2013 | $949 | $22,900 | $3,775 | $19,125 |
Source: Public Records
Map
Nearby Homes
- 827 Seabrook St
- 139 Easy St
- 245 Shawnee Rd
- 231 Southside Cir
- Par 152 Sulpher Springs
- 302 Buckingham Dr
- 209 Pocahontas St
- 532 Woodlawn Ave
- 525 Freeman Ave
- 228 Melton Rd
- 500 Buckingham Dr
- 338 Jefferson Ave
- 356 Woodlawn Ave
- 346 Woodlawn Ave
- 581 Summit Ridge Dr
- 241 & 245 White Oak Ave
- 152 Sulphur Springs Rd
- 560 Rack Ln
- Par 152 Sulphur Springs Rd
- 405 7th St
- 226 Charles St
- 238 Charles St
- 231 Charles St
- 225 Charles St
- 244 Charles St
- 237 Charles St
- 634 Ratcliff St
- 640 Ratcliff St
- 644 Ratcliff St
- 236 English St
- 230 English St
- 642 Lookout Dr
- 643 Forty Foot St
- 242 English St
- 222 English St
- 626 Lookout Dr
- 218 English St
- 652 Lookout Dr
- 634 Forty Foot St
- 633 Lookout Dr