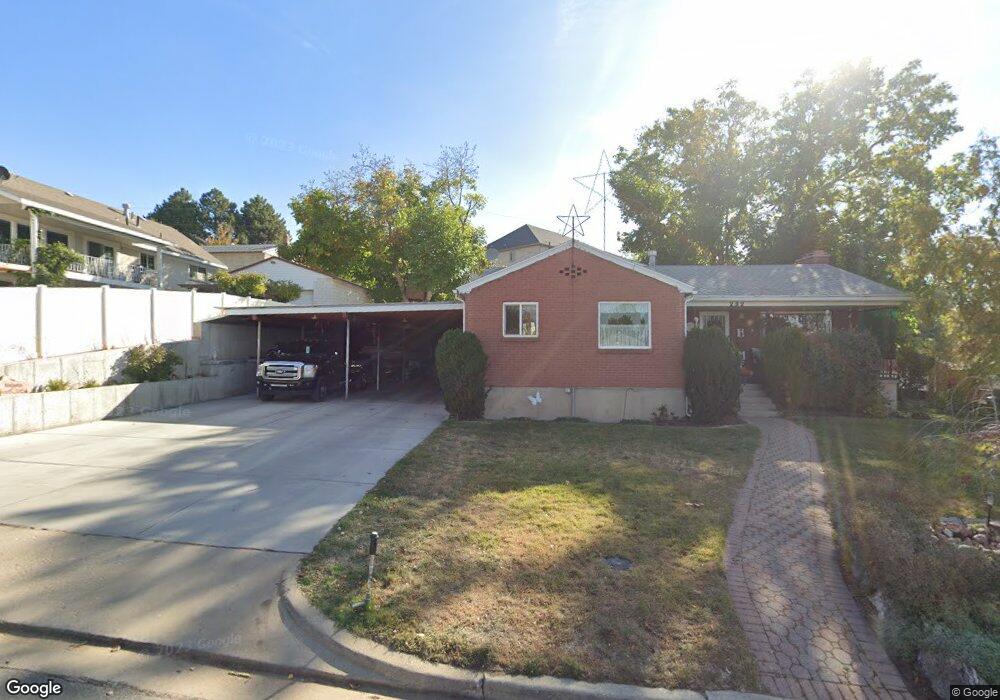
232 E 2450 S Bountiful, UT 84010
Estimated Value: $602,000 - $631,000
4
Beds
1
Bath
1,804
Sq Ft
$343/Sq Ft
Est. Value
About This Home
This home is located at 232 E 2450 S, Bountiful, UT 84010 and is currently estimated at $619,337, approximately $343 per square foot. 232 E 2450 S is a home located in Davis County with nearby schools including Muir School, Mueller Park Junior High School, and Woods Cross High School.
Ownership History
Date
Name
Owned For
Owner Type
Purchase Details
Closed on
Mar 24, 2020
Sold by
Nielsen Bart
Bought by
Nielsen Bart and Nielsen Cathy
Current Estimated Value
Purchase Details
Closed on
May 3, 2018
Sold by
Nielsen Bart
Bought by
Nielsen Bart and Nielsen Cathy
Home Financials for this Owner
Home Financials are based on the most recent Mortgage that was taken out on this home.
Original Mortgage
$168,000
Outstanding Balance
$144,511
Interest Rate
4.45%
Mortgage Type
New Conventional
Estimated Equity
$474,826
Purchase Details
Closed on
May 2, 2018
Sold by
Brown Pamla Nielsen and Nielsen Sybil W
Bought by
Nielsen Bart
Home Financials for this Owner
Home Financials are based on the most recent Mortgage that was taken out on this home.
Original Mortgage
$168,000
Outstanding Balance
$144,511
Interest Rate
4.45%
Mortgage Type
New Conventional
Estimated Equity
$474,826
Purchase Details
Closed on
Aug 22, 2008
Sold by
Nielsen Sybil W
Bought by
Nielsen Sybil W
Create a Home Valuation Report for This Property
The Home Valuation Report is an in-depth analysis detailing your home's value as well as a comparison with similar homes in the area
Purchase History
| Date | Buyer | Sale Price | Title Company |
|---|---|---|---|
| Nielsen Bart | -- | Platinum Title Services | |
| Nielsen Bait | -- | None Available | |
| Nielsen Bart | -- | Platinum Title | |
| Nielsen Bart | -- | Platinum Title | |
| Nielsen Sybil W | -- | None Available |
Source: Public Records
Mortgage History
| Date | Status | Borrower | Loan Amount |
|---|---|---|---|
| Open | Nielsen Bart | $168,000 |
Source: Public Records
Tax History
| Year | Tax Paid | Tax Assessment Tax Assessment Total Assessment is a certain percentage of the fair market value that is determined by local assessors to be the total taxable value of land and additions on the property. | Land | Improvement |
|---|---|---|---|---|
| 2025 | $3,622 | $326,150 | $152,135 | $174,015 |
| 2024 | $3,394 | $316,250 | $142,397 | $173,853 |
| 2023 | $3,247 | $549,000 | $255,920 | $293,080 |
| 2022 | $3,396 | $315,700 | $138,145 | $177,555 |
| 2021 | $2,807 | $397,000 | $181,047 | $215,953 |
| 2020 | $2,506 | $355,000 | $152,378 | $202,622 |
| 2019 | $2,535 | $351,000 | $146,264 | $204,736 |
| 2018 | $2,374 | $323,000 | $143,055 | $179,945 |
| 2016 | $2,162 | $151,140 | $66,493 | $84,647 |
| 2015 | $2,019 | $140,415 | $66,493 | $73,922 |
| 2014 | $1,897 | $131,044 | $66,493 | $64,551 |
| 2013 | -- | $125,514 | $53,897 | $71,617 |
Source: Public Records
Map
Nearby Homes
- 2292 S 250 E
- 2273 S 200 E
- 69 E North Canyon Rd
- 110 2250 S
- 320 E 2100 S
- 19 E North Canyon Rd
- 2053 S 350 E Unit 7
- 296 E 2050 S Unit 2
- 2046 S 350 E Unit 4
- 295 E 2050 S Unit 1
- 2038 S 350 E Unit 3
- 188 E 2050 S Unit D3
- 2059 S 350 E Unit 6
- 610 Meadowlark Ln
- 41 E 2200 S
- 2064 S Orchard Dr
- 2 E Wicker Ln
- 761 San Simeon Way
- 1886 S Jeri Dr
- 831 E San Simeon Way S
Your Personal Tour Guide
Ask me questions while you tour the home.