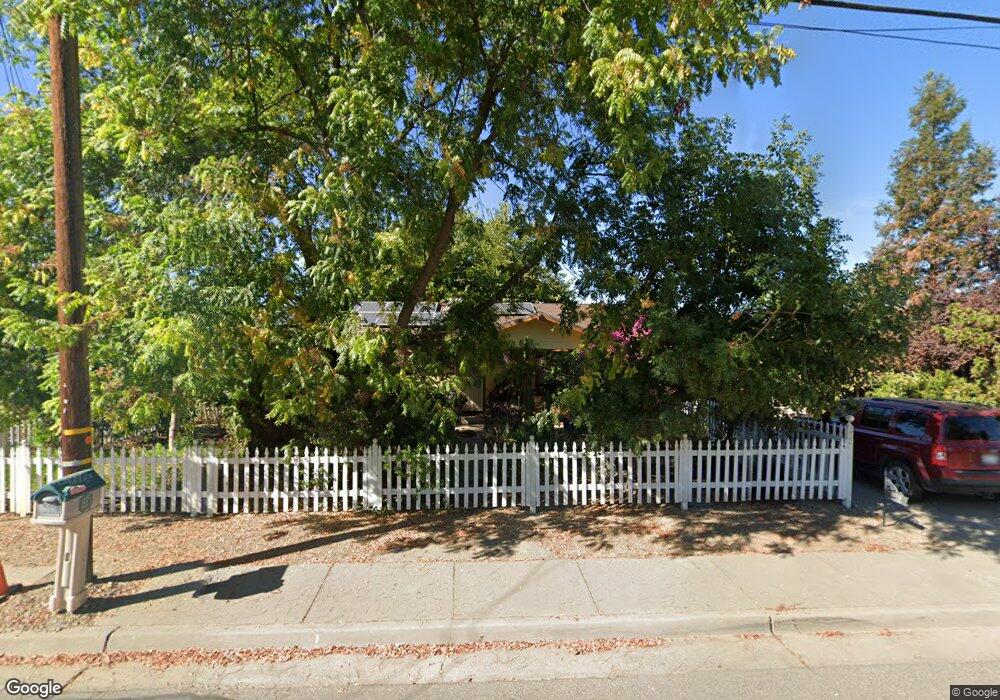
232 E Yolo St Orland, CA 95963
Estimated Value: $290,000 - $377,000
3
Beds
2
Baths
1,288
Sq Ft
$261/Sq Ft
Est. Value
About This Home
This home is located at 232 E Yolo St, Orland, CA 95963 and is currently estimated at $336,094, approximately $260 per square foot. 232 E Yolo St is a home located in Glenn County with nearby schools including Fairview Elementary School, Mill Street Elementary School, and Price Intermediate School.
Ownership History
Date
Name
Owned For
Owner Type
Purchase Details
Closed on
Dec 12, 2023
Sold by
Pacheco Rafael Ramirez
Bought by
Ramirez Pacheco Family Living Trust and Pacheco
Current Estimated Value
Purchase Details
Closed on
Feb 8, 2006
Sold by
Mattson Troy Dean and Mattson Gena E
Bought by
Pacheco Rafael Ramirez
Home Financials for this Owner
Home Financials are based on the most recent Mortgage that was taken out on this home.
Original Mortgage
$51,500
Interest Rate
6.21%
Mortgage Type
Fannie Mae Freddie Mac
Purchase Details
Closed on
Feb 7, 2006
Sold by
Mattson Troy Dean and Mattson Gena E
Bought by
Pacheco Rafael Ramirez
Home Financials for this Owner
Home Financials are based on the most recent Mortgage that was taken out on this home.
Original Mortgage
$51,500
Interest Rate
6.21%
Mortgage Type
Fannie Mae Freddie Mac
Create a Home Valuation Report for This Property
The Home Valuation Report is an in-depth analysis detailing your home's value as well as a comparison with similar homes in the area
Purchase History
| Date | Buyer | Sale Price | Title Company |
|---|---|---|---|
| Ramirez Pacheco Family Living Trust | -- | None Listed On Document | |
| Pacheco Rafael Ramirez | $205,000 | Glenn County Title Company | |
| Pacheco Rafael Ramirez | $205,000 | Glenn County Title Company |
Source: Public Records
Mortgage History
| Date | Status | Borrower | Loan Amount |
|---|---|---|---|
| Previous Owner | Pacheco Rafael Ramirez | $51,500 | |
| Previous Owner | Pacheco Rafael Ramirez | $51,500 |
Source: Public Records
Tax History
| Year | Tax Paid | Tax Assessment Tax Assessment Total Assessment is a certain percentage of the fair market value that is determined by local assessors to be the total taxable value of land and additions on the property. | Land | Improvement |
|---|---|---|---|---|
| 2025 | $2,696 | $274,634 | $80,379 | $194,255 |
| 2024 | $2,696 | $248,430 | $60,000 | $188,430 |
| 2023 | $2,238 | $207,025 | $50,000 | $157,025 |
| 2022 | $2,033 | $188,205 | $43,000 | $145,205 |
| 2021 | $1,869 | $171,095 | $38,633 | $132,462 |
| 2020 | $1,715 | $155,541 | $35,121 | $120,420 |
| 2019 | $1,576 | $141,402 | $31,929 | $109,473 |
| 2018 | $1,404 | $132,153 | $29,841 | $102,312 |
| 2017 | $1,413 | $125,860 | $28,420 | $97,440 |
| 2016 | $1,333 | $124,000 | $28,000 | $96,000 |
| 2015 | $1,267 | $118,000 | $27,000 | $91,000 |
| 2014 | $1,208 | $112,516 | $25,889 | $86,627 |
Source: Public Records
Map
Nearby Homes
- 919 East St
- 1682 Almondwood Dr
- 246 E Shasta St
- 1633 Almondwood Dr
- 1332 East St
- 329 Byron Way
- 512 East St
- 1645 Olivewood Dr
- 325 Byron Way
- 904 E Walker St
- 1579 Oakwood Dr
- 104 South St
- 346 Stanton Way
- 698 Hambright Ave
- 303 Colusa St
- 1325 Coby Ln
- 333 Yuba St
- 100 Frances Ln
- 4280 County Rd N
- 1019 W Monterey St
Your Personal Tour Guide
Ask me questions while you tour the home.