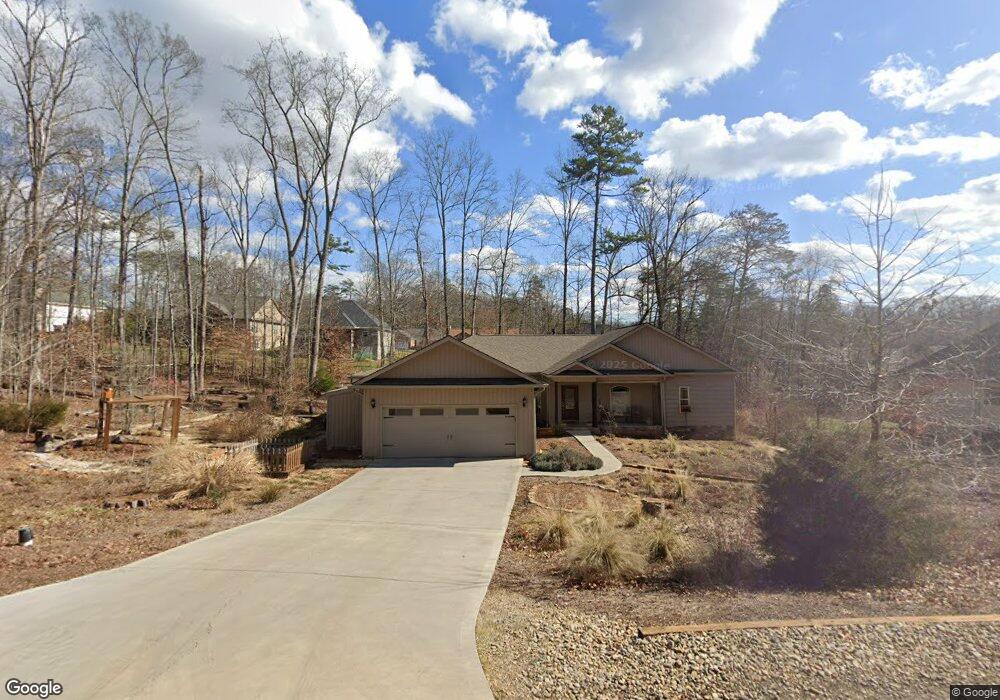
232 Elohi Way Loudon, TN 37774
Tellico Village NeighborhoodEstimated Value: $556,289 - $653,000
3
Beds
2
Baths
2,149
Sq Ft
$283/Sq Ft
Est. Value
About This Home
This home is located at 232 Elohi Way, Loudon, TN 37774 and is currently estimated at $607,572, approximately $282 per square foot. 232 Elohi Way is a home located in Loudon County with nearby schools including Loudon High School.
Ownership History
Date
Name
Owned For
Owner Type
Purchase Details
Closed on
Mar 30, 2015
Sold by
Mashburn Home Builder Llc
Bought by
Hamerslag Karen and Shryock John
Current Estimated Value
Purchase Details
Closed on
Oct 27, 2014
Sold by
Cs Holdings Llc
Bought by
Mashburn Home Builder Llc
Purchase Details
Closed on
Oct 14, 2014
Purchase Details
Closed on
Dec 23, 2013
Sold by
Cs Paradiso Holdings Llc
Bought by
Cs Holdings Llc
Purchase Details
Closed on
Dec 22, 2009
Bought by
Cs Paradiso Holdings Llc
Purchase Details
Closed on
Aug 20, 2004
Sold by
Loudon County
Bought by
National Recreational Properti
Purchase Details
Closed on
Dec 30, 2003
Bought by
Loudon County
Purchase Details
Closed on
Jan 4, 1995
Sold by
Cooper Communities
Bought by
Jerome Reband and Jerome Nancy E
Purchase Details
Closed on
Aug 23, 1993
Bought by
Cooper Communities
Purchase Details
Closed on
Feb 27, 1991
Bought by
Miller Charles D and Miller Sonya L
Create a Home Valuation Report for This Property
The Home Valuation Report is an in-depth analysis detailing your home's value as well as a comparison with similar homes in the area
Home Values in the Area
Average Home Value in this Area
Purchase History
| Date | Buyer | Sale Price | Title Company |
|---|---|---|---|
| Hamerslag Karen | $238,727 | -- | |
| Mashburn Home Builder Llc | $4,000 | -- | |
| -- | -- | -- | |
| Cs Holdings Llc | -- | -- | |
| Cs Holdings Llc | -- | -- | |
| Cs Paradiso Holdings Llc | $1,875,000 | -- | |
| National Recreational Properti | $1,100 | -- | |
| Loudon County | $8,700 | -- | |
| Jerome Reband | $9,000 | -- | |
| Cooper Communities | $10,400 | -- | |
| Miller Charles D | $10,400 | -- |
Source: Public Records
Tax History Compared to Growth
Tax History
| Year | Tax Paid | Tax Assessment Tax Assessment Total Assessment is a certain percentage of the fair market value that is determined by local assessors to be the total taxable value of land and additions on the property. | Land | Improvement |
|---|---|---|---|---|
| 2025 | $1,357 | $90,650 | $3,750 | $86,900 |
| 2023 | $1,357 | $90,650 | $0 | $0 |
| 2022 | $1,357 | $89,400 | $2,500 | $86,900 |
| 2021 | $1,357 | $89,400 | $2,500 | $86,900 |
| 2020 | $1,340 | $89,400 | $2,500 | $86,900 |
| 2019 | $1,340 | $74,325 | $2,500 | $71,825 |
| 2018 | $1,340 | $74,325 | $2,500 | $71,825 |
| 2017 | $1,314 | $72,850 | $2,500 | $70,350 |
| 2016 | $1,044 | $56,150 | $3,750 | $52,400 |
| 2015 | $1,044 | $56,150 | $3,750 | $52,400 |
| 2014 | $70 | $3,750 | $3,750 | $0 |
Source: Public Records
Map
Nearby Homes