Estimated Value: $469,830
--
Bed
--
Bath
4,800
Sq Ft
$98/Sq Ft
Est. Value
About This Home
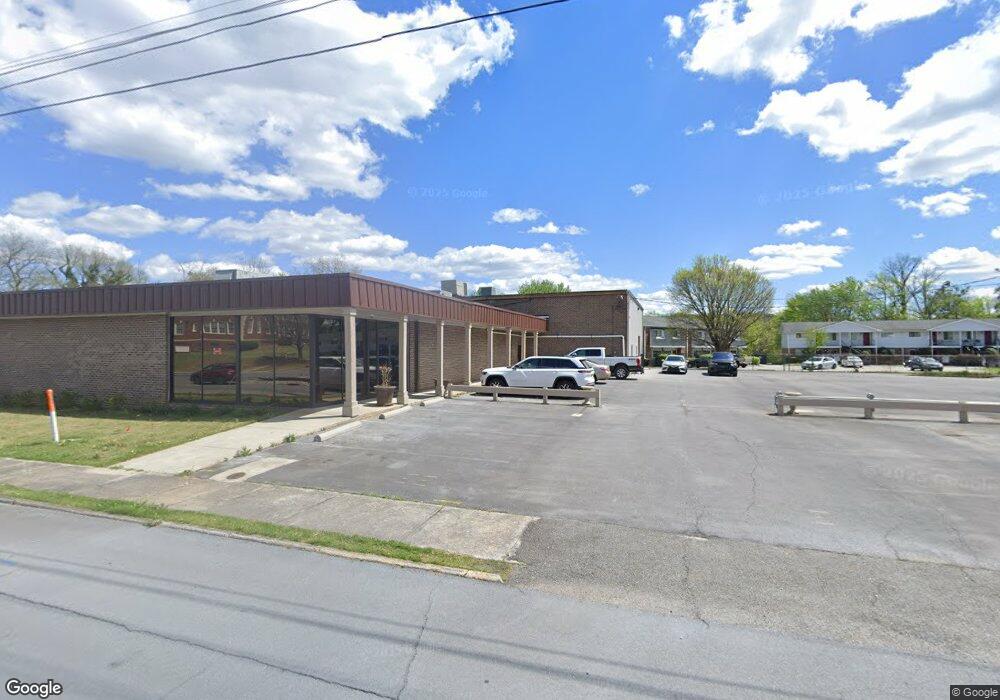
This home is located at 232 Glen Milner Blvd, Rome, GA 30161 and is currently estimated at $469,830, approximately $97 per square foot. 232 Glen Milner Blvd is a home located in Floyd County with nearby schools including Dan McCarty Middle School, Rome High School, and St. Mary School.
Ownership History
Date
Name
Owned For
Owner Type
Purchase Details
Closed on
Feb 7, 2022
Sold by
Chip Properties Llc
Bought by
Sprould Holdings Llc
Current Estimated Value
Purchase Details
Closed on
Mar 5, 2020
Sold by
Riddle Bradford L
Bought by
Chip Properties Llc
Purchase Details
Closed on
Nov 1, 2006
Sold by
Not Provided
Bought by
Riddle Brad L
Purchase Details
Closed on
Dec 14, 1996
Sold by
Riddle Riddle G and Riddle 8
Bought by
Riddle Vivian H 4 and Int 8
Purchase Details
Closed on
Dec 13, 1996
Sold by
Riddle Riddle G and Riddle 8
Bought by
Riddle G H Sr 4
Purchase Details
Closed on
Dec 11, 1996
Sold by
G H and G Brad L
Bought by
Riddle G H Sr 4
Purchase Details
Closed on
Jan 7, 1978
Bought by
P and R
Purchase Details
Closed on
Jan 6, 1978
Sold by
Riddle G H
Bought by
Riddle G H
Purchase Details
Closed on
Jan 5, 1978
Sold by
Polk Paulding Co Dev Corp
Bought by
Riddle G H
Purchase Details
Closed on
Jan 2, 1946
Bought by
Ledbetter Trucks Inc
Create a Home Valuation Report for This Property
The Home Valuation Report is an in-depth analysis detailing your home's value as well as a comparison with similar homes in the area
Home Values in the Area
Average Home Value in this Area
Purchase History
| Date | Buyer | Sale Price | Title Company |
|---|---|---|---|
| Sprould Holdings Llc | $357,700 | -- | |
| Chip Properties Llc | -- | -- | |
| Riddle Brad L | -- | -- | |
| Riddle Vivian H 4 | -- | -- | |
| Riddle G H Sr 4 | -- | -- | |
| Riddle G H Sr 4 | -- | -- | |
| P | -- | -- | |
| Riddle G H | -- | -- | |
| G H | -- | -- | |
| Riddle G H | -- | -- | |
| Polk Paulding Co Dev Corp | $48,000 | -- | |
| Ledbetter Trucks Inc | -- | -- |
Source: Public Records
Tax History Compared to Growth
Tax History
| Year | Tax Paid | Tax Assessment Tax Assessment Total Assessment is a certain percentage of the fair market value that is determined by local assessors to be the total taxable value of land and additions on the property. | Land | Improvement |
|---|---|---|---|---|
| 2024 | $6,939 | $195,943 | $37,071 | $158,872 |
| 2023 | $4,763 | $159,516 | $37,071 | $122,445 |
| 2022 | $5,335 | $146,208 | $33,701 | $112,507 |
| 2021 | $5,299 | $142,803 | $33,701 | $109,102 |
| 2020 | $5,345 | $142,863 | $33,701 | $109,162 |
| 2019 | $4,973 | $134,340 | $33,701 | $100,639 |
| 2018 | $5,034 | $135,991 | $33,701 | $102,290 |
| 2017 | $5,096 | $137,641 | $33,701 | $103,940 |
| 2016 | $5,169 | $139,200 | $33,680 | $105,520 |
| 2015 | $4,754 | $135,556 | $33,680 | $101,876 |
| 2014 | $4,754 | $135,556 | $33,680 | $101,876 |
Source: Public Records
Map
Nearby Homes
- 206 E 4th St
- 320 E 3rd Ave
- 702 River Ave SW
- 2 Coral Ave SW
- 312 E 3rd St
- 214 E 3rd St
- 29 Pear St
- 2 Fair St SW
- 801 Maple Ave SW
- 202 E 4th Ave Unit 5
- 202 E 4th Ave
- 407 E 3rd St
- 10 E 3rd Ave
- 8 E 3rd Ave
- 311 Roswell Ave SE
- 138 E 8th Ave Unit 25
- 9 Eastridge Ct SW
- 2 E 10th St SW
- 166 E 11th St SW
- 232 S Broad St SW
- 234 Glenn Milner Blvd
- 234 Glen Milner Blvd
- 220 Glen Milner Blvd
- 300 Glen Milner Blvd
- 511 Plaza Place
- 0 Plaza Place Unit 3150287
- 203 Glen Milner Blvd
- 420 E 3rd Ave
- 304 Glen Milner Blvd
- 306 Glenn Milner Blvd
- 306 Glen Milner Blvd
- 418 E 3rd Ave
- 505 E 2nd Ave
- 414 E 3rd Ave
- 415 E 2nd Ave
- 3 E 3rd Ave
- 415 E 2nd Ave
- 523 E 2nd Ave
- 410 E 3rd Ave
- 15 Riverbend Dr SW