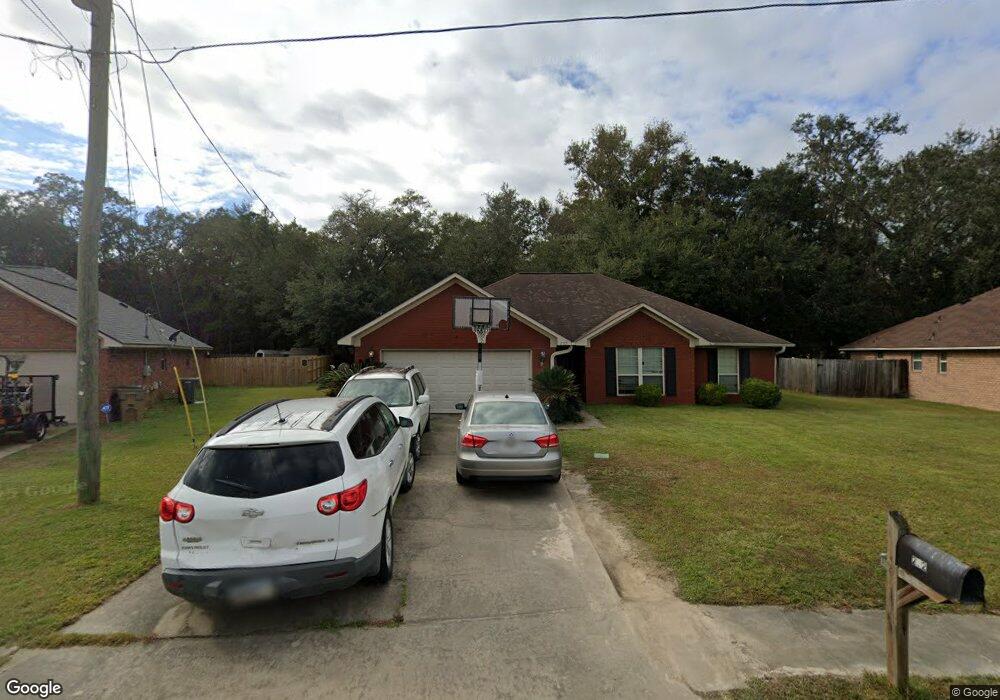
232 Gloucester Dr Midway, GA 31320
Estimated Value: $272,049 - $296,000
3
Beds
2
Baths
1,848
Sq Ft
$151/Sq Ft
Est. Value
About This Home
This home is located at 232 Gloucester Dr, Midway, GA 31320 and is currently estimated at $278,512, approximately $150 per square foot. 232 Gloucester Dr is a home located in Liberty County with nearby schools including Liberty Elementary School, Midway Middle School, and Liberty County High School.
Ownership History
Date
Name
Owned For
Owner Type
Purchase Details
Closed on
Apr 26, 2023
Sold by
Wiley Christina R
Bought by
Move Realty Group Llc
Current Estimated Value
Purchase Details
Closed on
Jul 29, 2011
Sold by
Federal National Mortgage Association
Bought by
Varnedoe Christina R
Home Financials for this Owner
Home Financials are based on the most recent Mortgage that was taken out on this home.
Original Mortgage
$140,000
Interest Rate
4.53%
Mortgage Type
USDA
Purchase Details
Closed on
Mar 1, 2011
Sold by
Bac Home Loans Servicing
Bought by
Federal National Mortgage Association
Purchase Details
Closed on
Aug 16, 2006
Sold by
Dryden Enterprises Inc
Bought by
Dominic Veronica and Dalson Linda A
Home Financials for this Owner
Home Financials are based on the most recent Mortgage that was taken out on this home.
Original Mortgage
$190,000
Interest Rate
6.73%
Mortgage Type
New Conventional
Create a Home Valuation Report for This Property
The Home Valuation Report is an in-depth analysis detailing your home's value as well as a comparison with similar homes in the area
Purchase History
| Date | Buyer | Sale Price | Title Company |
|---|---|---|---|
| Move Realty Group Llc | -- | -- | |
| Varnedoe Christina R | $140,000 | -- | |
| Federal National Mortgage Association | $169,100 | -- | |
| Dominic Veronica | $192,925 | -- |
Source: Public Records
Mortgage History
| Date | Status | Borrower | Loan Amount |
|---|---|---|---|
| Previous Owner | Varnedoe Christina R | $140,000 | |
| Previous Owner | Dominic Veronica | $190,000 |
Source: Public Records
Tax History
| Year | Tax Paid | Tax Assessment Tax Assessment Total Assessment is a certain percentage of the fair market value that is determined by local assessors to be the total taxable value of land and additions on the property. | Land | Improvement |
|---|---|---|---|---|
| 2024 | $4,808 | $99,111 | $12,000 | $87,111 |
| 2023 | $4,136 | $88,742 | $12,000 | $76,742 |
| 2022 | $2,915 | $74,412 | $12,000 | $62,412 |
| 2021 | $2,185 | $63,354 | $10,000 | $53,354 |
| 2020 | $2,159 | $61,384 | $10,000 | $51,384 |
| 2019 | $2,053 | $61,955 | $10,000 | $51,955 |
| 2018 | $1,984 | $57,273 | $10,000 | $47,273 |
| 2017 | $2,227 | $52,477 | $10,000 | $42,477 |
| 2016 | $1,766 | $63,521 | $12,000 | $51,521 |
| 2015 | $1,761 | $63,521 | $12,000 | $51,521 |
| 2014 | $1,761 | $79,874 | $12,000 | $67,874 |
| 2013 | -- | $67,541 | $12,000 | $55,541 |
Source: Public Records
Map
Nearby Homes
- 182 Gloucester Dr
- 0000 E Oglethorpe Hwy
- 0 S Coastal Hwy
- 62 Alder Pass
- 46 Carver Way
- 362 Cottage Loop
- 670 Stone Ct
- 648 Stone Ct
- 152 Holland Dr
- 1019 Stone Ct
- 94 Buckingham Dr
- 1057 Stone Ct
- 54 Cottage Loop
- 92 Holland Dr NE
- 268 Alder Pass
- 135 Kettle Creek Ln
- 0 E Oglethorpe Unit SA341930
- 0 E Oglethorpe Unit 153327
- 0 E Oglethorpe Unit 10592168
- 0 E Oglethorpe Unit SA350017
- 232 Buckingham Dr
- 242 Gloucester Dr
- 226 Gloucester Dr
- 250 Gloucester Dr
- 216 Gloucester Dr
- 225 Gloucester Dr
- 227 Gloucester Dr
- 146 John Bacon
- 247 Gloucester Dr
- 262 Gloucester Dr
- 208 Gloucester Dr
- 257 Gloucester Dr
- 197 Gloucester Dr
- 276 Gloucester Dr Unit n/a
- 276 Gloucester Dr
- 111 John Bacon
- 267 Gloucester Dr
- 0 John Bacon Rd
- 177 Gloucester Dr
- 288 Gloucester Dr
Your Personal Tour Guide
Ask me questions while you tour the home.